Difference between revisions of "User:Jhurley/sandbox"
(→Background) |
(→Lysimeters for Measuring PFAS Concentrations in the Vadose Zone) |
||
| (432 intermediate revisions by the same user not shown) | |||
| Line 1: | Line 1: | ||
| − | == | + | ==Lysimeters for Measuring PFAS Concentrations in the Vadose Zone== |
| − | + | [[Perfluoroalkyl and Polyfluoroalkyl Substances (PFAS) | PFAS]] are frequently introduced to the environment through soil surface applications which then transport through the vadose zone to reach underlying groundwater receptors. Due to their unique properties and resulting transport and retention behaviors, PFAS in the vadose zone can be a persistent contaminant source to underlying groundwater systems. Determining the fraction of PFAS present in the mobile porewater relative to the total concentrations in soils is critical to understanding the risk posed by PFAS in vadose zone source areas. Lysimeters are instruments that have been used by agronomists and vadose zone researchers for decades to determine water flux and solute concentrations in unsaturated porewater. Lysimeters have recently been developed as a critical tool for field investigations and characterizations of PFAS impacted source zones. | |
| − | |||
<div style="float:right;margin:0 0 2em 2em;">__TOC__</div> | <div style="float:right;margin:0 0 2em 2em;">__TOC__</div> | ||
'''Related Article(s):''' | '''Related Article(s):''' | ||
| − | *[[ | + | *[[Perfluoroalkyl and Polyfluoroalkyl Substances (PFAS)]] |
| − | *[[ | + | *[[PFAS Transport and Fate]] |
| − | *[[ | + | *[[PFAS Toxicology and Risk Assessment]] |
| − | + | *[[Mass Flux and Mass Discharge]] | |
| − | |||
| − | |||
| − | |||
| − | |||
| − | |||
| − | |||
| − | |||
| − | |||
| − | |||
| − | |||
| − | |||
| − | * | ||
| − | |||
| − | |||
| − | |||
| − | + | '''Contributors:''' Dr. John F. Stults, Dr. Charles Schaefer | |
| − | + | '''Key Resources:''' | |
| + | *Assessment of PFAS in Collocated Soil and Porewater Samples at an AFFF-Impacted Source Zone: Field-Scale Validation of Suction Lysimeters<ref name="AndersonEtAl2022"/> | ||
| + | *PFAS Concentrations in Soil versus Soil Porewater: Mass Distributions and the Impact of Adsorption at Air-Water Interfaces<ref name="BrusseauGuo2022"/> | ||
| + | *Using Suction Lysimeters for Determining the Potential of Per- and Polyfluoroalkyl Substances to Leach from Soil to Groundwater: A Review<ref name="CostanzaEtAl2025"/> | ||
| + | *Use of Lysimeters for Monitoring Soil Water Balance Parameters and Nutrient Leaching<ref name="MeissnerEtAl2020"/> | ||
| + | *PFAS Porewater Concentrations in Unsaturated Soil: Field and Laboratory Comparisons Inform on PFAS Accumulation at Air-Water Interfaces<ref name="SchaeferEtAl2024"/> | ||
| − | == | + | ==Introduction== |
| − | + | Lysimeters are devices that are placed in the subsurface above the groundwater table to monitor the movement of water through the soil<ref name="GossEhlers2009">Goss, M.J., Ehlers, W., 2009. The Role of Lysimeters in the Development of Our Understanding of Soil Water and Nutrient Dynamics in Ecosystems. Soil Use and Management, 25(3), pp. 213–223. [https://doi.org/10.1111/j.1475-2743.2009.00230.x doi: 10.1111/j.1475-2743.2009.00230.x]</ref><ref>Pütz, T., Fank, J., Flury, M., 2018. Lysimeters in Vadose Zone Research. Vadose Zone Journal, 17 (1), pp. 1-4. [https://doi.org/10.2136/vzj2018.02.0035 doi: 10.2136/vzj2018.02.0035] [[Media: PutzEtAl2018.pdf | Open Access Article]]</ref><ref name="CostanzaEtAl2025">Costanza, J., Clabaugh, C.D., Leibli, C., Ferreira, J., Wilkin, R.T., 2025. Using Suction Lysimeters for Determining the Potential of Per- and Polyfluoroalkyl Substances to Leach from Soil to Groundwater: A Review. Environmental Science and Technology, 59(9), pp. 4215-4229. [https://doi.org/10.1021/acs.est.4c10246 doi: 10.1021/acs.est.4c10246]</ref>. Lysimeters have historically been used in agricultural sciences for monitoring nutrient or contaminant movement, soil moisture release curves, natural drainage patterns, and dynamics of plant-water interactions<ref name="GossEhlers2009"/><ref>Bergström, L., 1990. Use of Lysimeters to Estimate Leaching of Pesticides in Agricultural Soils. Environmental Pollution, 67 (4), 325–347. [https://doi.org/10.1016/0269-7491(90)90070-S doi: 10.1016/0269-7491(90)90070-S]</ref><ref>Dabrowska, D., Rykala, W., 2021. A Review of Lysimeter Experiments Carried Out on Municipal Landfill Waste. Toxics, 9(2), Article 26. [https://doi.org/10.3390/toxics9020026 doi: 10.3390/toxics9020026] [[Media: Dabrowska Rykala2021.pdf | Open Access Article]]</ref><ref>Fernando, S.U., Galagedara, L., Krishnapillai, M., Cuss, C.W., 2023. Lysimeter Sampling System for Optimal Determination of Trace Elements in Soil Solutions. Water, 15(18), Article 3277. [https://doi.org/10.3390/w15183277 doi: 10.3390/w15183277] [[Media: FernandoEtAl2023.pdf | Open Access Article]]</ref><ref name="MeissnerEtAl2020">Meissner, R., Rupp, H., Haselow, L., 2020. Use of Lysimeters for Monitoring Soil Water Balance Parameters and Nutrient Leaching. In: Climate Change and Soil Interactions. Elsevier, pp. 171-205. [https://doi.org/10.1016/B978-0-12-818032-7.00007-2 doi: 10.1016/B978-0-12-818032-7.00007-2]</ref><ref name="RogersMcConnell1993">Rogers, R.D., McConnell, J.W. Jr., 1993. Lysimeter Literature Review, Nuclear Regulatory Commission Report Numbers: NUREG/CR--6073, EGG--2706. [https://www.osti.gov/] ID: 10183270. [https://doi.org/10.2172/10183270 doi: 10.2172/10183270] [[Media: RogersMcConnell1993.pdf | Open Access Article]]</ref><ref>Sołtysiak, M., Rakoczy, M., 2019. An Overview of the Experimental Research Use of Lysimeters. Environmental and Socio-Economic Studies, 7(2), pp. 49-56. [https://doi.org/10.2478/environ-2019-0012 doi: 10.2478/environ-2019-0012] [[Media: SołtysiakRakoczy2019.pdf | Open Access Article]]</ref><ref name="Stannard1992">Stannard, D.I., 1992. Tensiometers—Theory, Construction, and Use. Geotechnical Testing Journal, 15(1), pp. 48-58. [https://doi.org/10.1520/GTJ10224J doi: 10.1520/GTJ10224J]</ref><ref name="WintonWeber1996">Winton, K., Weber, J.B., 1996. A Review of Field Lysimeter Studies to Describe the Environmental Fate of Pesticides. Weed Technology, 10(1), pp. 202-209. [https://doi.org/10.1017/S0890037X00045929 doi: 10.1017/S0890037X00045929]</ref>. Recently, there has been strong interest in the use of lysimeters to measure and monitor movement of per- and polyfluoroalkyl substances (PFAS) through the vadose zone<ref name="Anderson2021">Anderson, R.H., 2021. The Case for Direct Measures of Soil-to-Groundwater Contaminant Mass Discharge at AFFF-Impacted Sites. Environmental Science and Technology, 55(10), pp. 6580-6583. [https://doi.org/10.1021/acs.est.1c01543 doi: 10.1021/acs.est.1c01543]</ref><ref name="AndersonEtAl2022">Anderson, R.H., Feild, J.B., Dieffenbach-Carle, H., Elsharnouby, O., Krebs, R.K., 2022. Assessment of PFAS in Collocated Soil and Porewater Samples at an AFFF-Impacted Source Zone: Field-Scale Validation of Suction Lysimeters. Chemosphere, 308(1), Article 136247. [https://doi.org/10.1016/j.chemosphere.2022.136247 doi: 10.1016/j.chemosphere.2022.136247]</ref><ref name="SchaeferEtAl2024">Schaefer, C.E., Nguyen, D., Fang, Y., Gonda, N., Zhang, C., Shea, S., Higgins, C.P., 2024. PFAS Porewater Concentrations in Unsaturated Soil: Field and Laboratory Comparisons Inform on PFAS Accumulation at Air-Water Interfaces. Journal of Contaminant Hydrology, 264, Article 104359. [https://doi.org/10.1016/j.jconhyd.2024.104359 doi: 10.1016/j.jconhyd.2024.104359] [[Media: SchaeferEtAl2024.pdf | Open Access Manuscript]]</ref><ref name="SchaeferEtAl2023">Schaefer, C.E., Lavorgna, G.M., Lippincott, D.R., Nguyen, D., Schaum, A., Higgins, C.P., Field, J., 2023. Leaching of Perfluoroalkyl Acids During Unsaturated Zone Flushing at a Field Site Impacted with Aqueous Film Forming Foam. Environmental Science and Technology, 57(5), pp. 1940-1948. [https://doi.org/10.1021/acs.est.2c06903 doi: 10.1021/acs.est.2c06903]</ref><ref name="SchaeferEtAl2022">Schaefer, C.E., Lavorgna, G.M., Lippincott, D.R., Nguyen, D., Christie, E., Shea, S., O’Hare, S., Lemes, M.C.S., Higgins, C.P., Field, J., 2022. A Field Study to Assess the Role of Air-Water Interfacial Sorption on PFAS Leaching in an AFFF Source Area. Journal of Contaminant Hydrology, 248, Article 104001. [https://doi.org/10.1016/j.jconhyd.2022.104001 doi: 10.1016/j.jconhyd.2022.104001] [[Media: SchaeferEtAl2022.pdf | Open Access Manuscript]]</ref><ref name="QuinnanEtAl2021">Quinnan, J., Rossi, M., Curry, P., Lupo, M., Miller, M., Korb, H., Orth, C., Hasbrouck, K., 2021. Application of PFAS-Mobile Lab to Support Adaptive Characterization and Flux-Based Conceptual Site Models at AFFF Releases. Remediation, 31(3), pp. 7-26. [https://doi.org/10.1002/rem.21680 doi: 10.1002/rem.21680]</ref>. PFAS are frequently introduced to the environment through land surface application and have been found to be strongly retained within the upper 5 feet of soil<ref name="BrusseauEtAl2020">Brusseau, M.L., Anderson, R.H., Guo, B., 2020. PFAS Concentrations in Soils: Background Levels versus Contaminated Sites. Science of The Total Environment, 740, Article 140017. [https://doi.org/10.1016/j.scitotenv.2020.140017 doi: 10.1016/j.scitotenv.2020.140017]</ref><ref name="BiglerEtAl2024">Bigler, M.C., Brusseau, M.L., Guo, B., Jones, S.L., Pritchard, J.C., Higgins, C.P., Hatton, J., 2024. High-Resolution Depth-Discrete Analysis of PFAS Distribution and Leaching for a Vadose-Zone Source at an AFFF-Impacted Site. Environmental Science and Technology, 58(22), pp. 9863-9874. [https://doi.org/10.1021/acs.est.4c01615 doi: 10.1021/acs.est.4c01615]</ref>. PFAS recalcitrance in the vadose zone means that environmental program managers and consultants need a cost-effective way of monitoring concentration conditions within the vadose zone. Repeated soil sampling and extraction processes are time consuming and only give a representative concentration of total PFAS in the matrix<ref name="NickersonEtAl2020">Nickerson, A., Maizel, A.C., Kulkarni, P.R., Adamson, D.T., Kornuc, J. J., Higgins, C.P., 2020. Enhanced Extraction of AFFF-Associated PFASs from Source Zone Soils. Environmental Science and Technology, 54(8), pp. 4952-4962. [https://doi.org/10.1021/acs.est.0c00792 doi: 10.1021/acs.est.0c00792]</ref>, not what is readily transportable in mobile porewater<ref name="SchaeferEtAl2023"/><ref name="StultsEtAl2024">Stults, J.F., Schaefer, C.E., Fang, Y., Devon, J., Nguyen, D., Real, I., Hao, S., Guelfo, J.L., 2024. Air-Water Interfacial Collapse and Rate-Limited Solid Desorption Control Perfluoroalkyl Acid Leaching from the Vadose Zone. Journal of Contaminant Hydrology, 265, Article 104382. [https://doi.org/10.1016/j.jconhyd.2024.104382 doi: 10.1016/j.jconhyd.2024.104382] [[Media: StultsEtAl2024.pdf | Open Access Manuscript]]</ref><ref name="StultsEtAl2023">Stults, J.F., Choi, Y.J., Rockwell, C., Schaefer, C.E., Nguyen, D.D., Knappe, D.R.U., Illangasekare, T.H., Higgins, C.P., 2023. Predicting Concentration- and Ionic-Strength-Dependent Air–Water Interfacial Partitioning Parameters of PFASs Using Quantitative Structure–Property Relationships (QSPRs). Environmental Science and Technology, 57(13), pp. 5203-5215. [https://doi.org/10.1021/acs.est.2c07316 doi: 10.1021/acs.est.2c07316]</ref><ref name="BrusseauGuo2022">Brusseau, M.L., Guo, B., 2022. PFAS Concentrations in Soil versus Soil Porewater: Mass Distributions and the Impact of Adsorption at Air-Water Interfaces. Chemosphere, 302, Article 134938. [https://doi.org/10.1016/j.chemosphere.2022.134938 doi: 10.1016/j.chemosphere.2022.134938] [[Media: BrusseauGuo2022.pdf | Open Access Manuscript]]</ref>. Fortunately, lysimeters have been found to be a viable option for monitoring the concentration of PFAS in the mobile porewater phase in the vadose zone<ref name="Anderson2021"/><ref name="AndersonEtAl2022"/>. Note that while some lysimeters, known as weighing lysimeters, can directly measure water flux, the most commonly utilized lysimeters in PFAS investigations only provide measurements of porewater concentrations. | |
| − | |||
| − | |||
| − | + | ==PFAS Background== | |
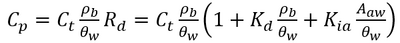
| + | PFAS are a broad class of chemicals with highly variable chemical structures<ref>Moody, C.A., Field, J.A., 1999. Determination of Perfluorocarboxylates in Groundwater Impacted by Fire-Fighting Activity. Environmental Science and Technology, 33(16), pp. 2800-2806. [https://doi.org/10.1021/es981355+ doi: 10.1021/es981355+]</ref><ref name="MoodyField2000">Moody, C.A., Field, J.A., 2000. Perfluorinated Surfactants and the Environmental Implications of Their Use in Fire-Fighting Foams. Environmental Science and Technology, 34(18), pp. 3864-3870. [https://doi.org/10.1021/es991359u doi: 10.1021/es991359u]</ref><ref name="GlügeEtAl2020">Glüge, J., Scheringer, M., Cousins, I.T., DeWitt, J.C., Goldenman, G., Herzke, D., Lohmann, R., Ng, C.A., Trier, X., Wang, Z., 2020. An Overview of the Uses of Per- and Polyfluoroalkyl Substances (PFAS). Environmental Science: Processes and Impacts, 22(12), pp. 2345-2373. [https://doi.org/10.1039/D0EM00291G doi: 10.1039/D0EM00291G] [[Media: GlügeEtAl2020.pdf | Open Access Article]]</ref>. One characteristic feature of PFAS is that they are fluorosurfactants, distinct from more traditional hydrocarbon surfactants<ref name="MoodyField2000"/><ref name="Brusseau2018">Brusseau, M.L., 2018. Assessing the Potential Contributions of Additional Retention Processes to PFAS Retardation in the Subsurface. Science of The Total Environment, 613-614, pp. 176-185. [https://doi.org/10.1016/j.scitotenv.2017.09.065 doi: 10.1016/j.scitotenv.2017.09.065] [[Media: Brusseau2018.pdf | Open Access Manuscript]]</ref><ref>Dave, N., Joshi, T., 2017. A Concise Review on Surfactants and Its Significance. International Journal of Applied Chemistry, 13(3), pp. 663-672. [https://doi.org/10.37622/IJAC/13.3.2017.663-672 doi: 10.37622/IJAC/13.3.2017.663-672] [[Media: DaveJoshi2017.pdf | Open Access Article]]</ref><ref>García, R.A., Chiaia-Hernández, A.C., Lara-Martin, P.A., Loos, M., Hollender, J., Oetjen, K., Higgins, C.P., Field, J.A., 2019. Suspect Screening of Hydrocarbon Surfactants in Afffs and Afff-Contaminated Groundwater by High-Resolution Mass Spectrometry. Environmental Science and Technology, 53(14), pp. 8068-8077. [https://doi.org/10.1021/acs.est.9b01895 doi: 10.1021/acs.est.9b01895]</ref>. Fluorosurfactants typically have a fully or partially fluorinated, hydrophobic tail with ionic (cationic, zwitterionic, or anionic) head group that is hydrophilic<ref name="MoodyField2000"/><ref name="GlügeEtAl2020"/>. The hydrophobic tail and ionic head group mean PFAS are very stable at hydrophobic adsorption interfaces when present in the aqueous phase<ref>Krafft, M.P., Riess, J.G., 2015. Per- and Polyfluorinated Substances (PFASs): Environmental Challenges. Current Opinion in Colloid and Interface Science, 20(3), pp. 192-212. [https://doi.org/10.1016/j.cocis.2015.07.004 doi: 10.1016/j.cocis.2015.07.004]</ref>. Examples of these interfaces include naturally occurring organic matter in soils and the air-water interface in the vadose zone<ref>Schaefer, C.E., Culina, V., Nguyen, D., Field, J., 2019. Uptake of Poly- and Perfluoroalkyl Substances at the Air–Water Interface. Environmental Science and Technology, 53(21), pp. 12442-12448. [https://doi.org/10.1021/acs.est.9b04008 doi: 10.1021/acs.est.9b04008]</ref><ref>Lyu, Y., Brusseau, M.L., Chen, W., Yan, N., Fu, X., Lin, X., 2018. Adsorption of PFOA at the Air–Water Interface during Transport in Unsaturated Porous Media. Environmental Science and Technology, 52(14), pp. 7745-7753. [https://doi.org/10.1021/acs.est.8b02348 doi: 10.1021/acs.est.8b02348]</ref><ref>Costanza, J., Arshadi, M., Abriola, L.M., Pennell, K.D., 2019. Accumulation of PFOA and PFOS at the Air-Water Interface. Environmental Science and Technology Letters, 6(8), pp. 487-491. [https://doi.org/10.1021/acs.estlett.9b00355 doi: 10.1021/acs.estlett.9b00355]</ref><ref>Li, F., Fang, X., Zhou, Z., Liao, X., Zou, J., Yuan, B., Sun, W., 2019. Adsorption of Perfluorinated Acids onto Soils: Kinetics, Isotherms, and Influences of Soil Properties. Science of The Total Environment, 649, pp. 504-514. [https://doi.org/10.1016/j.scitotenv.2018.08.209 doi: 10.1016/j.scitotenv.2018.08.209]</ref><ref>Nguyen, T.M.H., Bräunig, J., Thompson, K., Thompson, J., Kabiri, S., Navarro, D.A., Kookana, R.S., Grimison, C., Barnes, C.M., Higgins, C.P., McLaughlin, M.J., Mueller, J.F., 2020. Influences of Chemical Properties, Soil Properties, and Solution pH on Soil–Water Partitioning Coefficients of Per- and Polyfluoroalkyl Substances (PFASs). Environmental Science and Technology, 54(24), pp. 15883-15892. [https://doi.org/10.1021/acs.est.0c05705 doi: 10.1021/acs.est.0c05705] [[Media: NguyenEtAl2020.pdf | Open Access Article]]</ref>. Their strong adsorption to both soil organic matter and the air-water interface is a major contributor to elevated concentrations of PFAS observed in the upper 5 feet of the soil column<ref name="BrusseauEtAl2020"/><ref name="BiglerEtAl2024"/>. While several other PFAS partitioning processes exist<ref name="Brusseau2018"/>, adsorption to solid phase soils and air-water interfaces are the two primary processes present at nearly all PFAS sites<ref>Brusseau, M.L., Yan, N., Van Glubt, S., Wang, Y., Chen, W., Lyu, Y., Dungan, B., Carroll, K.C., Holguin, F.O., 2019. Comprehensive Retention Model for PFAS Transport in Subsurface Systems. Water Research, 148, pp. 41-50. [https://doi.org/10.1016/j.watres.2018.10.035 doi: 10.1016/j.watres.2018.10.035]</ref>. The total PFAS mass obtained from a vadose zone soil sample contains the solid phase, air-water interfacial, and aqueous phase PFAS mass, which can be converted to porewater concentrations using Equation 1<ref name="BrusseauGuo2022"/>.</br> | ||
| + | :: <big>'''Equation 1:'''</big> [[File: StultsEq1.png | 400 px]]</br> | ||
| + | Where ''C<sub>p</sub>'' is the porewater concentration, ''C<sub>t</sub>'' is the total PFAS concentration, ''ρ<sub>b</sub>'' is the bulk density of the soil, ''θ<sub>w</sub>'' is the volumetric water content, ''R<sub>d</sub>'' is the PFAS retardation factor, ''K<sub>d</sub>'' is the solid phase adsorption coefficient, ''K<sub>ia</sub>'' is the air-water interfacial adsorption coefficient, and ''A<sub>aw</sub>'' is the air-water interfacial area. The air-water interfacial area of the soil is primarily a function of both the soil properties and the degree of volumetric water saturation in the soil. There are several methods of estimating air-water interfacial areas including thermodynamic functions based on the soil moisture retention curve. However, the thermodynamic function has been shown to underestimate air-water interfacial area<ref name="Brusseau2023">Brusseau, M.L., 2023. Determining Air-Water Interfacial Areas for the Retention and Transport of PFAS and Other Interfacially Active Solutes in Unsaturated Porous Media. Science of The Total Environment, 884, Article 163730. [https://doi.org/10.1016/j.scitotenv.2023.163730 doi: 10.1016/j.scitotenv.2023.163730] [[Media: Brusseau2023.pdf | Open Access Article]]</ref>, and must typically be scaled using empirical scaling factors. An empirical method recently developed to estimate air-water interfacial area is presented in Equation 2<ref name="Brusseau2023"/>.</br> | ||
| + | :: <big>'''Equation 2:'''</big> [[File: StultsEq2.png | 400 px]]</br> | ||
| + | Where ''S<sub>w</sub>'' is the water phase saturation as a ratio of the water content over the volumetric soil porosity, and ''d<sub>50</sub>'' is the median grain diameter. | ||
| − | + | ==Lysimeters Background== | |
| + | [[File: StultsFig1.png |thumb|600 px|Figure 1. (a) A field suction lysimeter with labeled parts typically used in field settings – Credit: Bibek Acharya and Dr. Vivek Sharma, UF/IFAS, https://edis.ifas.ufl.edu/publication/AE581. (b) Laboratory suction lysimeters used in Schaefer ''et al.'' 2024<ref name="SchaeferEtAl2024"/>, which employed the use of micro-sampling suction lysimeters. (c) A field lysimeter used in Schaefer ''et al.'' 2023<ref name="SchaeferEtAl2023"/>. (d) Diagram of a drainage wicking lysimeter – Credit: Edaphic Scientific, https://edaphic.com.au/products/water/lysimeter-wick-for-drainage/]] | ||
| + | Lysimeters, generally speaking, refer to instruments which collect water from unsaturated soils<ref name="MeissnerEtAl2020"/><ref name="RogersMcConnell1993"/>. However, there are multiple types of lysimeters which can be employed in field or laboratory settings. There are three primary types of lysimeters relevant to PFAS listed here and shown in Figure 1a-d. | ||
| + | # <u>Suction Lysimeters (Figure 1a,b):</u> These lysimeters are the most relevant for PFAS sampling and are the majority of discussion in this article. These lysimeters operate by extracting liquid from the unsaturated vadose zone by applying negative suction pressure at the sampling head<ref name="CostanzaEtAl2025"/><ref name="SchaeferEtAl2024"/><ref name="QuinnanEtAl2021"/>. The sampling head is typically constructed of porous ceramic or stainless steel. A PVC case or stainless-steel case is attached to the sampling head and extends upward above the ground surface. Suction lysimeters are typically installed between 1 and 9 feet below ground surface, but can extend as deep as 40-60 feet in some cases<ref name="CostanzaEtAl2025"/>. Shallow lysimeters (< 10 feet) are typically installed using a hand auger. For ceramic lysimeters, a silica flour slurry should be placed at the base of the bore hole and allowed to cover the ceramic head before backfilling the hole partially with natural soil. Once the hole is partially backfilled with soil to cover the sampling head, the remainder of the casing should be sealed with hydrated bentonite chips. When sampling events occur, suction is applied at the ground surface using a rubber gasket seal and a hand pump or electric pump. After sufficient porewater is collected (the time for which can vary greatly based on the soil permeability and moisture content), the seal can be removed and a peristaltic pump used to extract liquid from the lysimeter. | ||
| + | # <u>Field Lysimeters (Figure 1c):</u> These large lysimeters can be constructed from plastic or metal sidings. They can range from approximately 2 feet in diameter to as large as several meters in diameter<ref name="MeissnerEtAl2020"/>. Instrumentation such as soil moisture probes and tensiometers, or even multiple suction lysimeters, are typically placed throughout the lysimeter to measure the movement of water and determine characteristic soil moisture release curves<ref name="Stannard1992"/><ref name="WintonWeber1996"/><ref name="SchaeferEtAl2023"/><ref name="SchaeferEtAl2022"/><ref>van Genuchten, M.Th. , 1980. A Closed‐form Equation for Predicting the Hydraulic Conductivity of Unsaturated Soils. Soil Science Society of America Journal, 44(5), pp. 892-898. [https://doi.org/10.2136/sssaj1980.03615995004400050002x doi: 10.2136/sssaj1980.03615995004400050002x]</ref>. Water is typically collected at the base of the field lysimeter to determine net recharge through the system. These field lysimeters are intended to represent more realistic, intermediate scale conditions of field systems. | ||
| + | # <u>Drainage Lysimeters (Figure 1d):</u> Also known as a “wick” lysimeter, these lysimeters typically consist of a hollow cup attached to a spout which protrudes above ground to relieve air pressure from the system and act as a sampling port. The hollow cup typically has filters and wicking devices at the base to collect water from the soil. The cup is filled with natural soil and collects water as it percolates through the vadose zone. These lysimeters are used to directly monitor net recharge from the vadose zone to the groundwater table and could be useful in determining PFAS mass flux. | ||
| − | + | ==Analysis of PFAS Concentrations in Soil and Porewater== | |
| + | {| class="wikitable mw-collapsible" style="float:left; margin-right:20px; text-align:center;" | ||
| + | |+Table 1. Measured and Predicted PFAS Concentrations in Porewater for Select PFAS in Three Different Soils | ||
| + | |- | ||
| + | !Site | ||
| + | !PFAS | ||
| + | !Field</br>Porewater</br>Concentration</br>(μg/L) | ||
| + | !Lab Core</br>Porewater</br>Concentration</br>(μg/L) | ||
| + | !Predicted</br>Porewater</br>Concentration</br>(μg/L) | ||
| + | |- | ||
| + | |Site A||PFOS||6.2 ± 3.4||3.0 ± 0.37||6.6 ± 3.3 | ||
| + | |- | ||
| + | |Site B||PFOS||2.2 ± 2.0||0.78 ± 0.38||2.8 | ||
| + | |- | ||
| + | |rowspan="3"|Site C||PFOS||13 ± 4.1||680 ± 460||164 ± 75 | ||
| + | |- | ||
| + | |8:2 FTS||1.2 ± 0.46||52 ± 13||16 ± 6.0 | ||
| + | |- | ||
| + | |PFHpS||0.36 ± 0.051||2.9 ± 2.0||5.9 ± 3.4 | ||
| + | |} | ||
| + | [[File: StultsFig2.png | thumb | 600 px | Figure 2. Field Measured PFAS concentration Data (Orange) and Lab Core Measured Concentration Data (Blue) for four PFAS impacted sites<ref name="AndersonEtAl2022"/>]] | ||
| + | [[File: StultsFig3.png | thumb | 400 px | Figure 3. Measured and predicted data for PFAS concentrations from a single site field lysimeter study. Model predictions both with and without PFAS sorption to the air-water interface were considered<ref name="SchaeferEtAl2023"/>.]] | ||
| + | Schaefer ''et al.''<ref name="SchaeferEtAl2024"/> measured PFAS porewater concentrations with field and laboratory suction lysimeters across several sites. Intact cores from the site were collected for soil water extraction using laboratory lysimeters. The lysimeters were used to directly compare field derived measurements of PFAS concentration in the mobile porewater phase. Results from measurements are for four sites presented in Figure 2. | ||
| − | + | Data from sites A and B showed reasonably good agreement (within ½ order of magnitude) for most PFAS measured in the systems. At site C, more hydrophobic constituents (> C6 PFAS) tended to have higher concentrations in the lab core than the field site while less hydrophobic constituents (< C6) had higher concentrations in the field than lab cores. Site D showed substantially greater (1 order of magnitude or more) PFAS concentrations measured in the laboratory-collected porewater sample compared to what was measured in the field lysimeters. This discrepancy for the Site D soil can likely be attributed to soil heterogeneity (as indicated by ground penetrating radar) and the fact that the soil consisted of back-filled materials rather than undisturbed native soils. | |
| − | + | Site C showed elevated PFAS concentrations in the laboratory collected porewater for the more surface-active compounds. This increase was attributed to the soil wetting that occurred at the bench scale, which was reasonably described by the model shown in Equations 1 and 2 (see Table 1<ref name="AndersonEtAl2022"/>). Equations 1 and 2 were also used to predict PFAS porewater concentrations (using porous cup lysimeters) in a highly instrumented test cell<ref name="SchaeferEtAl2023"/>(Figure 3). The ability to predict soil concentrations from recurring porewater samples is critical to the practical application of lysimeters in field settings<ref name="AndersonEtAl2022"/>. | |
| − | |||
| − | |||
| − | |||
| − | |||
| − | + | Results from suction lysimeters studies and field lysimeter studies show that PFAS concentrations in porewater predicted from soil concentrations using Equations 1 and 2 generally have reasonable agreement with measured ''in situ'' porewater data when air-water interfacial partitioning is considered. Results show that for less hydrophobic components like PFOA, the impact of air-water interfacial adsorption is less significant than for highly hydrophobic components like PFOS. The soil for the field lysimeter in Figure 3 was a sandy soil with a relatively low air-water interfacial area. The effect of air-water interfacial partitioning is expected to be much more significant for a greater range of PFAS in soils with high capillary pressure (i.e. silts/clays) with higher associated air-water interfacial areas<ref name="Brusseau2023"/><ref>Peng, S., Brusseau, M.L., 2012. Air-Water Interfacial Area and Capillary Pressure: Porous-Medium Texture Effects and an Empirical Function. Journal of Hydrologic Engineering, 17(7), pp. 829-832. [https://doi.org/10.1061/(asce)he.1943-5584.0000515 doi: 10.1061/(asce)he.1943-5584.0000515]</ref><ref>Brusseau, M.L., Peng, S., Schnaar, G., Costanza-Robinson, M.S., 2006. Relationships among Air-Water Interfacial Area, Capillary Pressure, and Water Saturation for a Sandy Porous Medium. Water Resources Research, 42(3), Article W03501, 5 pages. [https://doi.org/10.1029/2005WR004058 doi: 10.1029/2005WR004058] [[Media: BrusseauEtAl2006.pdf | Free Access Article]]</ref>. | |
| − | The | + | ==Summary and Recommendations== |
| + | The majority of research with lysimeters for PFAS site investigations has been done using porous cup suction lysimeters<ref name="CostanzaEtAl2025"/><ref name="AndersonEtAl2022"/><ref name="SchaeferEtAl2024"/><ref name="QuinnanEtAl2021"/>. Porous cup suction lysimeters are advantageous because they can be routinely sampled or sampled after specific wetting or drying events much like groundwater wells. This sampling is easier and more efficient than routinely collecting soil samples from the same locations. Co-locating lysimeters with soil samples is important for establishing the baseline soil concentration levels at the lysimeter location and developing correlations between the soil concentrations and the mobile porewater concentration<ref name="CostanzaEtAl2025"/>. Appropriate standard operation procedures for lysimeter installation and operation have been established and have been reviewed in recent literature<ref name="CostanzaEtAl2025"/><ref name="SchaeferEtAl2024"/>. Lysimeters should typically be installed near the source area and just above the maximum groundwater level elevation to obtain accurate results of porewater concentrations year round. Depending upon the geology and vertical PFAS distribution in the soil, multilevel lysimeter installations should also be considered. | ||
| − | == | + | Results from several lysimeters studies across multiple field sites and modelling analysis has shown that lysimeters can produce reasonable results between field and laboratory studies<ref name="SchaeferEtAl2024"/><ref name="SchaeferEtAl2023"/><ref name="SchaeferEtAl2022"/>. Transient effects of wetting and drying as well as media heterogeneity affects appear to be responsible for some variability and uncertainty in lysimeter based PFAS measurements in the vadose zone. These mobile porewater concentrations can be coupled with effective recharge estimates and simplified modelling approaches to determine mass flux from the vadose zone to the underlying groundwater<ref name="Anderson2021"/><ref name="StultsEtAl2024"/><ref name="BrusseauGuo2022"/><ref>Stults, J.F., Schaefer, C.E., MacBeth, T., Fang, Y., Devon, J., Real, I., Liu, F., Kosson, D., Guelfo, J.L., 2025. Laboratory Validation of a Simplified Model for Estimating Equilibrium PFAS Mass Leaching from Unsaturated Soils. Science of The Total Environment, 970, Article 179036. [https://doi.org/10.1016/j.scitotenv.2025.179036 doi: 10.1016/j.scitotenv.2025.179036]</ref><ref>Smith, J. Brusseau, M.L., Guo, B., 2024. An Integrated Analytical Modeling Framework for Determining Site-Specific Soil Screening Levels for PFAS. Water Research, 252, Article121236. [https://doi.org/10.1016/j.watres.2024.121236 doi: 10.1016/j.watres.2024.121236]</ref>. |
| − | |||
| − | |||
| − | |||
| − | |||
| − | |||
| − | |||
| − | + | Future research opportunities should address the current key uncertainties related to the use of lysimeters for PFAS investigations, including: | |
| + | #<u>Collect larger datasets of PFAS concentrations</u> to determine how transient wetting or drying periods and media type affect PFAS concentrations in the mobile porewater. Some research has shown that non-equilibrium processes can occur in the vadose zone, which can affect grab sample concentration in the porewater at specific time periods. | ||
| + | #<u>More work should be done with flux averaging lysimeters</u> like the drainage cup or wicking lysimeter. These lysimeters can directly measure net recharge and provide time averaged concentrations of PFAS in water over the sampling period. However, there is little work detailing their potential applications in PFAS research, or operational considerations for their use in remedial investigations for PFAS. | ||
| + | #<u>Lysimeters should be coupled with monitoring of wetting and drying</u> in the vadose zone using ''in situ'' soil moisture sensors or tensiometers and groundwater levels. Direct measurements of soil saturation at field sites are vital to directly correlate porewater concentrations with soil concentrations. Similarly, groundwater level fluctuations can inform net recharge estimates. By collecting these data we can continue to improve partitioning and leaching models which can relate porewater concentrations to total PFAS mass in soils and PFAS leaching at field sites. | ||
| + | #<u>Comparisons of various bench-scale leaching or desorption tests to field-based lysimeter data</u> are recommended. The ability to correlate field measurements of PFAS concentrations with estimates of leaching from laboratory studies would provide a powerful method to empirically estimate PFAS leaching from field sites. | ||
==References== | ==References== | ||
Latest revision as of 15:50, 15 January 2026
Lysimeters for Measuring PFAS Concentrations in the Vadose Zone
PFAS are frequently introduced to the environment through soil surface applications which then transport through the vadose zone to reach underlying groundwater receptors. Due to their unique properties and resulting transport and retention behaviors, PFAS in the vadose zone can be a persistent contaminant source to underlying groundwater systems. Determining the fraction of PFAS present in the mobile porewater relative to the total concentrations in soils is critical to understanding the risk posed by PFAS in vadose zone source areas. Lysimeters are instruments that have been used by agronomists and vadose zone researchers for decades to determine water flux and solute concentrations in unsaturated porewater. Lysimeters have recently been developed as a critical tool for field investigations and characterizations of PFAS impacted source zones.
Related Article(s):
- Perfluoroalkyl and Polyfluoroalkyl Substances (PFAS)
- PFAS Transport and Fate
- PFAS Toxicology and Risk Assessment
- Mass Flux and Mass Discharge
Contributors: Dr. John F. Stults, Dr. Charles Schaefer
Key Resources:
- Assessment of PFAS in Collocated Soil and Porewater Samples at an AFFF-Impacted Source Zone: Field-Scale Validation of Suction Lysimeters[1]
- PFAS Concentrations in Soil versus Soil Porewater: Mass Distributions and the Impact of Adsorption at Air-Water Interfaces[2]
- Using Suction Lysimeters for Determining the Potential of Per- and Polyfluoroalkyl Substances to Leach from Soil to Groundwater: A Review[3]
- Use of Lysimeters for Monitoring Soil Water Balance Parameters and Nutrient Leaching[4]
- PFAS Porewater Concentrations in Unsaturated Soil: Field and Laboratory Comparisons Inform on PFAS Accumulation at Air-Water Interfaces[5]
Introduction
Lysimeters are devices that are placed in the subsurface above the groundwater table to monitor the movement of water through the soil[6][7][3]. Lysimeters have historically been used in agricultural sciences for monitoring nutrient or contaminant movement, soil moisture release curves, natural drainage patterns, and dynamics of plant-water interactions[6][8][9][10][4][11][12][13][14]. Recently, there has been strong interest in the use of lysimeters to measure and monitor movement of per- and polyfluoroalkyl substances (PFAS) through the vadose zone[15][1][5][16][17][18]. PFAS are frequently introduced to the environment through land surface application and have been found to be strongly retained within the upper 5 feet of soil[19][20]. PFAS recalcitrance in the vadose zone means that environmental program managers and consultants need a cost-effective way of monitoring concentration conditions within the vadose zone. Repeated soil sampling and extraction processes are time consuming and only give a representative concentration of total PFAS in the matrix[21], not what is readily transportable in mobile porewater[16][22][23][2]. Fortunately, lysimeters have been found to be a viable option for monitoring the concentration of PFAS in the mobile porewater phase in the vadose zone[15][1]. Note that while some lysimeters, known as weighing lysimeters, can directly measure water flux, the most commonly utilized lysimeters in PFAS investigations only provide measurements of porewater concentrations.
PFAS Background
PFAS are a broad class of chemicals with highly variable chemical structures[24][25][26]. One characteristic feature of PFAS is that they are fluorosurfactants, distinct from more traditional hydrocarbon surfactants[25][27][28][29]. Fluorosurfactants typically have a fully or partially fluorinated, hydrophobic tail with ionic (cationic, zwitterionic, or anionic) head group that is hydrophilic[25][26]. The hydrophobic tail and ionic head group mean PFAS are very stable at hydrophobic adsorption interfaces when present in the aqueous phase[30]. Examples of these interfaces include naturally occurring organic matter in soils and the air-water interface in the vadose zone[31][32][33][34][35]. Their strong adsorption to both soil organic matter and the air-water interface is a major contributor to elevated concentrations of PFAS observed in the upper 5 feet of the soil column[19][20]. While several other PFAS partitioning processes exist[27], adsorption to solid phase soils and air-water interfaces are the two primary processes present at nearly all PFAS sites[36]. The total PFAS mass obtained from a vadose zone soil sample contains the solid phase, air-water interfacial, and aqueous phase PFAS mass, which can be converted to porewater concentrations using Equation 1[2].
- Equation 1:
- Equation 1:
Where Cp is the porewater concentration, Ct is the total PFAS concentration, ρb is the bulk density of the soil, θw is the volumetric water content, Rd is the PFAS retardation factor, Kd is the solid phase adsorption coefficient, Kia is the air-water interfacial adsorption coefficient, and Aaw is the air-water interfacial area. The air-water interfacial area of the soil is primarily a function of both the soil properties and the degree of volumetric water saturation in the soil. There are several methods of estimating air-water interfacial areas including thermodynamic functions based on the soil moisture retention curve. However, the thermodynamic function has been shown to underestimate air-water interfacial area[37], and must typically be scaled using empirical scaling factors. An empirical method recently developed to estimate air-water interfacial area is presented in Equation 2[37].
- Equation 2:

- Equation 2:
Where Sw is the water phase saturation as a ratio of the water content over the volumetric soil porosity, and d50 is the median grain diameter.
Lysimeters Background

Lysimeters, generally speaking, refer to instruments which collect water from unsaturated soils[4][11]. However, there are multiple types of lysimeters which can be employed in field or laboratory settings. There are three primary types of lysimeters relevant to PFAS listed here and shown in Figure 1a-d.
- Suction Lysimeters (Figure 1a,b): These lysimeters are the most relevant for PFAS sampling and are the majority of discussion in this article. These lysimeters operate by extracting liquid from the unsaturated vadose zone by applying negative suction pressure at the sampling head[3][5][18]. The sampling head is typically constructed of porous ceramic or stainless steel. A PVC case or stainless-steel case is attached to the sampling head and extends upward above the ground surface. Suction lysimeters are typically installed between 1 and 9 feet below ground surface, but can extend as deep as 40-60 feet in some cases[3]. Shallow lysimeters (< 10 feet) are typically installed using a hand auger. For ceramic lysimeters, a silica flour slurry should be placed at the base of the bore hole and allowed to cover the ceramic head before backfilling the hole partially with natural soil. Once the hole is partially backfilled with soil to cover the sampling head, the remainder of the casing should be sealed with hydrated bentonite chips. When sampling events occur, suction is applied at the ground surface using a rubber gasket seal and a hand pump or electric pump. After sufficient porewater is collected (the time for which can vary greatly based on the soil permeability and moisture content), the seal can be removed and a peristaltic pump used to extract liquid from the lysimeter.
- Field Lysimeters (Figure 1c): These large lysimeters can be constructed from plastic or metal sidings. They can range from approximately 2 feet in diameter to as large as several meters in diameter[4]. Instrumentation such as soil moisture probes and tensiometers, or even multiple suction lysimeters, are typically placed throughout the lysimeter to measure the movement of water and determine characteristic soil moisture release curves[13][14][16][17][38]. Water is typically collected at the base of the field lysimeter to determine net recharge through the system. These field lysimeters are intended to represent more realistic, intermediate scale conditions of field systems.
- Drainage Lysimeters (Figure 1d): Also known as a “wick” lysimeter, these lysimeters typically consist of a hollow cup attached to a spout which protrudes above ground to relieve air pressure from the system and act as a sampling port. The hollow cup typically has filters and wicking devices at the base to collect water from the soil. The cup is filled with natural soil and collects water as it percolates through the vadose zone. These lysimeters are used to directly monitor net recharge from the vadose zone to the groundwater table and could be useful in determining PFAS mass flux.
Analysis of PFAS Concentrations in Soil and Porewater
| Site | PFAS | Field Porewater Concentration (μg/L) |
Lab Core Porewater Concentration (μg/L) |
Predicted Porewater Concentration (μg/L) |
|---|---|---|---|---|
| Site A | PFOS | 6.2 ± 3.4 | 3.0 ± 0.37 | 6.6 ± 3.3 |
| Site B | PFOS | 2.2 ± 2.0 | 0.78 ± 0.38 | 2.8 |
| Site C | PFOS | 13 ± 4.1 | 680 ± 460 | 164 ± 75 |
| 8:2 FTS | 1.2 ± 0.46 | 52 ± 13 | 16 ± 6.0 | |
| PFHpS | 0.36 ± 0.051 | 2.9 ± 2.0 | 5.9 ± 3.4 |


Schaefer et al.[5] measured PFAS porewater concentrations with field and laboratory suction lysimeters across several sites. Intact cores from the site were collected for soil water extraction using laboratory lysimeters. The lysimeters were used to directly compare field derived measurements of PFAS concentration in the mobile porewater phase. Results from measurements are for four sites presented in Figure 2.
Data from sites A and B showed reasonably good agreement (within ½ order of magnitude) for most PFAS measured in the systems. At site C, more hydrophobic constituents (> C6 PFAS) tended to have higher concentrations in the lab core than the field site while less hydrophobic constituents (< C6) had higher concentrations in the field than lab cores. Site D showed substantially greater (1 order of magnitude or more) PFAS concentrations measured in the laboratory-collected porewater sample compared to what was measured in the field lysimeters. This discrepancy for the Site D soil can likely be attributed to soil heterogeneity (as indicated by ground penetrating radar) and the fact that the soil consisted of back-filled materials rather than undisturbed native soils.
Site C showed elevated PFAS concentrations in the laboratory collected porewater for the more surface-active compounds. This increase was attributed to the soil wetting that occurred at the bench scale, which was reasonably described by the model shown in Equations 1 and 2 (see Table 1[1]). Equations 1 and 2 were also used to predict PFAS porewater concentrations (using porous cup lysimeters) in a highly instrumented test cell[16](Figure 3). The ability to predict soil concentrations from recurring porewater samples is critical to the practical application of lysimeters in field settings[1].
Results from suction lysimeters studies and field lysimeter studies show that PFAS concentrations in porewater predicted from soil concentrations using Equations 1 and 2 generally have reasonable agreement with measured in situ porewater data when air-water interfacial partitioning is considered. Results show that for less hydrophobic components like PFOA, the impact of air-water interfacial adsorption is less significant than for highly hydrophobic components like PFOS. The soil for the field lysimeter in Figure 3 was a sandy soil with a relatively low air-water interfacial area. The effect of air-water interfacial partitioning is expected to be much more significant for a greater range of PFAS in soils with high capillary pressure (i.e. silts/clays) with higher associated air-water interfacial areas[37][39][40].
Summary and Recommendations
The majority of research with lysimeters for PFAS site investigations has been done using porous cup suction lysimeters[3][1][5][18]. Porous cup suction lysimeters are advantageous because they can be routinely sampled or sampled after specific wetting or drying events much like groundwater wells. This sampling is easier and more efficient than routinely collecting soil samples from the same locations. Co-locating lysimeters with soil samples is important for establishing the baseline soil concentration levels at the lysimeter location and developing correlations between the soil concentrations and the mobile porewater concentration[3]. Appropriate standard operation procedures for lysimeter installation and operation have been established and have been reviewed in recent literature[3][5]. Lysimeters should typically be installed near the source area and just above the maximum groundwater level elevation to obtain accurate results of porewater concentrations year round. Depending upon the geology and vertical PFAS distribution in the soil, multilevel lysimeter installations should also be considered.
Results from several lysimeters studies across multiple field sites and modelling analysis has shown that lysimeters can produce reasonable results between field and laboratory studies[5][16][17]. Transient effects of wetting and drying as well as media heterogeneity affects appear to be responsible for some variability and uncertainty in lysimeter based PFAS measurements in the vadose zone. These mobile porewater concentrations can be coupled with effective recharge estimates and simplified modelling approaches to determine mass flux from the vadose zone to the underlying groundwater[15][22][2][41][42].
Future research opportunities should address the current key uncertainties related to the use of lysimeters for PFAS investigations, including:
- Collect larger datasets of PFAS concentrations to determine how transient wetting or drying periods and media type affect PFAS concentrations in the mobile porewater. Some research has shown that non-equilibrium processes can occur in the vadose zone, which can affect grab sample concentration in the porewater at specific time periods.
- More work should be done with flux averaging lysimeters like the drainage cup or wicking lysimeter. These lysimeters can directly measure net recharge and provide time averaged concentrations of PFAS in water over the sampling period. However, there is little work detailing their potential applications in PFAS research, or operational considerations for their use in remedial investigations for PFAS.
- Lysimeters should be coupled with monitoring of wetting and drying in the vadose zone using in situ soil moisture sensors or tensiometers and groundwater levels. Direct measurements of soil saturation at field sites are vital to directly correlate porewater concentrations with soil concentrations. Similarly, groundwater level fluctuations can inform net recharge estimates. By collecting these data we can continue to improve partitioning and leaching models which can relate porewater concentrations to total PFAS mass in soils and PFAS leaching at field sites.
- Comparisons of various bench-scale leaching or desorption tests to field-based lysimeter data are recommended. The ability to correlate field measurements of PFAS concentrations with estimates of leaching from laboratory studies would provide a powerful method to empirically estimate PFAS leaching from field sites.
References
- ^ 1.0 1.1 1.2 1.3 1.4 1.5 1.6 Anderson, R.H., Feild, J.B., Dieffenbach-Carle, H., Elsharnouby, O., Krebs, R.K., 2022. Assessment of PFAS in Collocated Soil and Porewater Samples at an AFFF-Impacted Source Zone: Field-Scale Validation of Suction Lysimeters. Chemosphere, 308(1), Article 136247. doi: 10.1016/j.chemosphere.2022.136247
- ^ 2.0 2.1 2.2 2.3 Brusseau, M.L., Guo, B., 2022. PFAS Concentrations in Soil versus Soil Porewater: Mass Distributions and the Impact of Adsorption at Air-Water Interfaces. Chemosphere, 302, Article 134938. doi: 10.1016/j.chemosphere.2022.134938 Open Access Manuscript
- ^ 3.0 3.1 3.2 3.3 3.4 3.5 3.6 Costanza, J., Clabaugh, C.D., Leibli, C., Ferreira, J., Wilkin, R.T., 2025. Using Suction Lysimeters for Determining the Potential of Per- and Polyfluoroalkyl Substances to Leach from Soil to Groundwater: A Review. Environmental Science and Technology, 59(9), pp. 4215-4229. doi: 10.1021/acs.est.4c10246
- ^ 4.0 4.1 4.2 4.3 Meissner, R., Rupp, H., Haselow, L., 2020. Use of Lysimeters for Monitoring Soil Water Balance Parameters and Nutrient Leaching. In: Climate Change and Soil Interactions. Elsevier, pp. 171-205. doi: 10.1016/B978-0-12-818032-7.00007-2
- ^ 5.0 5.1 5.2 5.3 5.4 5.5 5.6 5.7 Schaefer, C.E., Nguyen, D., Fang, Y., Gonda, N., Zhang, C., Shea, S., Higgins, C.P., 2024. PFAS Porewater Concentrations in Unsaturated Soil: Field and Laboratory Comparisons Inform on PFAS Accumulation at Air-Water Interfaces. Journal of Contaminant Hydrology, 264, Article 104359. doi: 10.1016/j.jconhyd.2024.104359 Open Access Manuscript
- ^ 6.0 6.1 Goss, M.J., Ehlers, W., 2009. The Role of Lysimeters in the Development of Our Understanding of Soil Water and Nutrient Dynamics in Ecosystems. Soil Use and Management, 25(3), pp. 213–223. doi: 10.1111/j.1475-2743.2009.00230.x
- ^ Pütz, T., Fank, J., Flury, M., 2018. Lysimeters in Vadose Zone Research. Vadose Zone Journal, 17 (1), pp. 1-4. doi: 10.2136/vzj2018.02.0035 Open Access Article
- ^ Bergström, L., 1990. Use of Lysimeters to Estimate Leaching of Pesticides in Agricultural Soils. Environmental Pollution, 67 (4), 325–347. doi: 10.1016/0269-7491(90)90070-S
- ^ Dabrowska, D., Rykala, W., 2021. A Review of Lysimeter Experiments Carried Out on Municipal Landfill Waste. Toxics, 9(2), Article 26. doi: 10.3390/toxics9020026 Open Access Article
- ^ Fernando, S.U., Galagedara, L., Krishnapillai, M., Cuss, C.W., 2023. Lysimeter Sampling System for Optimal Determination of Trace Elements in Soil Solutions. Water, 15(18), Article 3277. doi: 10.3390/w15183277 Open Access Article
- ^ 11.0 11.1 Rogers, R.D., McConnell, J.W. Jr., 1993. Lysimeter Literature Review, Nuclear Regulatory Commission Report Numbers: NUREG/CR--6073, EGG--2706. [1] ID: 10183270. doi: 10.2172/10183270 Open Access Article
- ^ Sołtysiak, M., Rakoczy, M., 2019. An Overview of the Experimental Research Use of Lysimeters. Environmental and Socio-Economic Studies, 7(2), pp. 49-56. doi: 10.2478/environ-2019-0012 Open Access Article
- ^ 13.0 13.1 Stannard, D.I., 1992. Tensiometers—Theory, Construction, and Use. Geotechnical Testing Journal, 15(1), pp. 48-58. doi: 10.1520/GTJ10224J
- ^ 14.0 14.1 Winton, K., Weber, J.B., 1996. A Review of Field Lysimeter Studies to Describe the Environmental Fate of Pesticides. Weed Technology, 10(1), pp. 202-209. doi: 10.1017/S0890037X00045929
- ^ 15.0 15.1 15.2 Anderson, R.H., 2021. The Case for Direct Measures of Soil-to-Groundwater Contaminant Mass Discharge at AFFF-Impacted Sites. Environmental Science and Technology, 55(10), pp. 6580-6583. doi: 10.1021/acs.est.1c01543
- ^ 16.0 16.1 16.2 16.3 16.4 16.5 16.6 Schaefer, C.E., Lavorgna, G.M., Lippincott, D.R., Nguyen, D., Schaum, A., Higgins, C.P., Field, J., 2023. Leaching of Perfluoroalkyl Acids During Unsaturated Zone Flushing at a Field Site Impacted with Aqueous Film Forming Foam. Environmental Science and Technology, 57(5), pp. 1940-1948. doi: 10.1021/acs.est.2c06903
- ^ 17.0 17.1 17.2 Schaefer, C.E., Lavorgna, G.M., Lippincott, D.R., Nguyen, D., Christie, E., Shea, S., O’Hare, S., Lemes, M.C.S., Higgins, C.P., Field, J., 2022. A Field Study to Assess the Role of Air-Water Interfacial Sorption on PFAS Leaching in an AFFF Source Area. Journal of Contaminant Hydrology, 248, Article 104001. doi: 10.1016/j.jconhyd.2022.104001 Open Access Manuscript
- ^ 18.0 18.1 18.2 Quinnan, J., Rossi, M., Curry, P., Lupo, M., Miller, M., Korb, H., Orth, C., Hasbrouck, K., 2021. Application of PFAS-Mobile Lab to Support Adaptive Characterization and Flux-Based Conceptual Site Models at AFFF Releases. Remediation, 31(3), pp. 7-26. doi: 10.1002/rem.21680
- ^ 19.0 19.1 Brusseau, M.L., Anderson, R.H., Guo, B., 2020. PFAS Concentrations in Soils: Background Levels versus Contaminated Sites. Science of The Total Environment, 740, Article 140017. doi: 10.1016/j.scitotenv.2020.140017
- ^ 20.0 20.1 Bigler, M.C., Brusseau, M.L., Guo, B., Jones, S.L., Pritchard, J.C., Higgins, C.P., Hatton, J., 2024. High-Resolution Depth-Discrete Analysis of PFAS Distribution and Leaching for a Vadose-Zone Source at an AFFF-Impacted Site. Environmental Science and Technology, 58(22), pp. 9863-9874. doi: 10.1021/acs.est.4c01615
- ^ Nickerson, A., Maizel, A.C., Kulkarni, P.R., Adamson, D.T., Kornuc, J. J., Higgins, C.P., 2020. Enhanced Extraction of AFFF-Associated PFASs from Source Zone Soils. Environmental Science and Technology, 54(8), pp. 4952-4962. doi: 10.1021/acs.est.0c00792
- ^ 22.0 22.1 Stults, J.F., Schaefer, C.E., Fang, Y., Devon, J., Nguyen, D., Real, I., Hao, S., Guelfo, J.L., 2024. Air-Water Interfacial Collapse and Rate-Limited Solid Desorption Control Perfluoroalkyl Acid Leaching from the Vadose Zone. Journal of Contaminant Hydrology, 265, Article 104382. doi: 10.1016/j.jconhyd.2024.104382 Open Access Manuscript
- ^ Stults, J.F., Choi, Y.J., Rockwell, C., Schaefer, C.E., Nguyen, D.D., Knappe, D.R.U., Illangasekare, T.H., Higgins, C.P., 2023. Predicting Concentration- and Ionic-Strength-Dependent Air–Water Interfacial Partitioning Parameters of PFASs Using Quantitative Structure–Property Relationships (QSPRs). Environmental Science and Technology, 57(13), pp. 5203-5215. doi: 10.1021/acs.est.2c07316
- ^ Moody, C.A., Field, J.A., 1999. Determination of Perfluorocarboxylates in Groundwater Impacted by Fire-Fighting Activity. Environmental Science and Technology, 33(16), pp. 2800-2806. doi: 10.1021/es981355+
- ^ 25.0 25.1 25.2 Moody, C.A., Field, J.A., 2000. Perfluorinated Surfactants and the Environmental Implications of Their Use in Fire-Fighting Foams. Environmental Science and Technology, 34(18), pp. 3864-3870. doi: 10.1021/es991359u
- ^ 26.0 26.1 Glüge, J., Scheringer, M., Cousins, I.T., DeWitt, J.C., Goldenman, G., Herzke, D., Lohmann, R., Ng, C.A., Trier, X., Wang, Z., 2020. An Overview of the Uses of Per- and Polyfluoroalkyl Substances (PFAS). Environmental Science: Processes and Impacts, 22(12), pp. 2345-2373. doi: 10.1039/D0EM00291G Open Access Article
- ^ 27.0 27.1 Brusseau, M.L., 2018. Assessing the Potential Contributions of Additional Retention Processes to PFAS Retardation in the Subsurface. Science of The Total Environment, 613-614, pp. 176-185. doi: 10.1016/j.scitotenv.2017.09.065 Open Access Manuscript
- ^ Dave, N., Joshi, T., 2017. A Concise Review on Surfactants and Its Significance. International Journal of Applied Chemistry, 13(3), pp. 663-672. doi: 10.37622/IJAC/13.3.2017.663-672 Open Access Article
- ^ García, R.A., Chiaia-Hernández, A.C., Lara-Martin, P.A., Loos, M., Hollender, J., Oetjen, K., Higgins, C.P., Field, J.A., 2019. Suspect Screening of Hydrocarbon Surfactants in Afffs and Afff-Contaminated Groundwater by High-Resolution Mass Spectrometry. Environmental Science and Technology, 53(14), pp. 8068-8077. doi: 10.1021/acs.est.9b01895
- ^ Krafft, M.P., Riess, J.G., 2015. Per- and Polyfluorinated Substances (PFASs): Environmental Challenges. Current Opinion in Colloid and Interface Science, 20(3), pp. 192-212. doi: 10.1016/j.cocis.2015.07.004
- ^ Schaefer, C.E., Culina, V., Nguyen, D., Field, J., 2019. Uptake of Poly- and Perfluoroalkyl Substances at the Air–Water Interface. Environmental Science and Technology, 53(21), pp. 12442-12448. doi: 10.1021/acs.est.9b04008
- ^ Lyu, Y., Brusseau, M.L., Chen, W., Yan, N., Fu, X., Lin, X., 2018. Adsorption of PFOA at the Air–Water Interface during Transport in Unsaturated Porous Media. Environmental Science and Technology, 52(14), pp. 7745-7753. doi: 10.1021/acs.est.8b02348
- ^ Costanza, J., Arshadi, M., Abriola, L.M., Pennell, K.D., 2019. Accumulation of PFOA and PFOS at the Air-Water Interface. Environmental Science and Technology Letters, 6(8), pp. 487-491. doi: 10.1021/acs.estlett.9b00355
- ^ Li, F., Fang, X., Zhou, Z., Liao, X., Zou, J., Yuan, B., Sun, W., 2019. Adsorption of Perfluorinated Acids onto Soils: Kinetics, Isotherms, and Influences of Soil Properties. Science of The Total Environment, 649, pp. 504-514. doi: 10.1016/j.scitotenv.2018.08.209
- ^ Nguyen, T.M.H., Bräunig, J., Thompson, K., Thompson, J., Kabiri, S., Navarro, D.A., Kookana, R.S., Grimison, C., Barnes, C.M., Higgins, C.P., McLaughlin, M.J., Mueller, J.F., 2020. Influences of Chemical Properties, Soil Properties, and Solution pH on Soil–Water Partitioning Coefficients of Per- and Polyfluoroalkyl Substances (PFASs). Environmental Science and Technology, 54(24), pp. 15883-15892. doi: 10.1021/acs.est.0c05705 Open Access Article
- ^ Brusseau, M.L., Yan, N., Van Glubt, S., Wang, Y., Chen, W., Lyu, Y., Dungan, B., Carroll, K.C., Holguin, F.O., 2019. Comprehensive Retention Model for PFAS Transport in Subsurface Systems. Water Research, 148, pp. 41-50. doi: 10.1016/j.watres.2018.10.035
- ^ 37.0 37.1 37.2 Brusseau, M.L., 2023. Determining Air-Water Interfacial Areas for the Retention and Transport of PFAS and Other Interfacially Active Solutes in Unsaturated Porous Media. Science of The Total Environment, 884, Article 163730. doi: 10.1016/j.scitotenv.2023.163730 Open Access Article
- ^ van Genuchten, M.Th. , 1980. A Closed‐form Equation for Predicting the Hydraulic Conductivity of Unsaturated Soils. Soil Science Society of America Journal, 44(5), pp. 892-898. doi: 10.2136/sssaj1980.03615995004400050002x
- ^ Peng, S., Brusseau, M.L., 2012. Air-Water Interfacial Area and Capillary Pressure: Porous-Medium Texture Effects and an Empirical Function. Journal of Hydrologic Engineering, 17(7), pp. 829-832. doi: 10.1061/(asce)he.1943-5584.0000515
- ^ Brusseau, M.L., Peng, S., Schnaar, G., Costanza-Robinson, M.S., 2006. Relationships among Air-Water Interfacial Area, Capillary Pressure, and Water Saturation for a Sandy Porous Medium. Water Resources Research, 42(3), Article W03501, 5 pages. doi: 10.1029/2005WR004058 Free Access Article
- ^ Stults, J.F., Schaefer, C.E., MacBeth, T., Fang, Y., Devon, J., Real, I., Liu, F., Kosson, D., Guelfo, J.L., 2025. Laboratory Validation of a Simplified Model for Estimating Equilibrium PFAS Mass Leaching from Unsaturated Soils. Science of The Total Environment, 970, Article 179036. doi: 10.1016/j.scitotenv.2025.179036
- ^ Smith, J. Brusseau, M.L., Guo, B., 2024. An Integrated Analytical Modeling Framework for Determining Site-Specific Soil Screening Levels for PFAS. Water Research, 252, Article121236. doi: 10.1016/j.watres.2024.121236