File:Fig4 dispanddiff.JPG
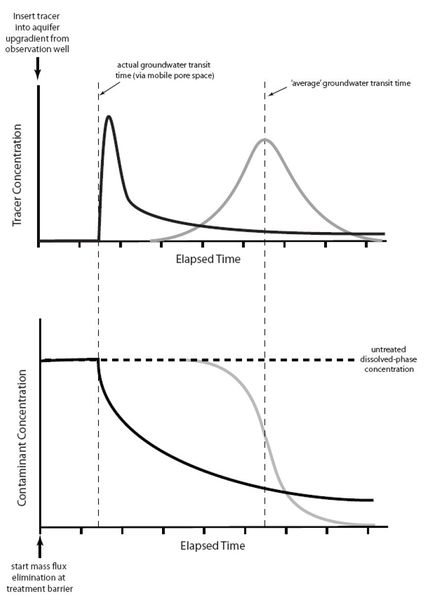
Revision as of 15:48, 16 September 2016 by Debra Tabron (talk | contribs) (Newell Figure 4. Comparison of tracer breakthrough (upper graph) and cleanup curves from advection-dispersion based (gray lines) and advection-diffusion based (black lines) solute transport)

Size of this preview: 439 × 600 pixels. Other resolutions: 175 × 240 pixels | 851 × 1,163 pixels.
Original file (851 × 1,163 pixels, file size: 61 KB, MIME type: image/jpeg)
Newell Figure 4. Comparison of tracer breakthrough (upper graph) and cleanup curves from advection-dispersion based (gray lines) and advection-diffusion based (black lines) solute transport
File history
Click on a date/time to view the file as it appeared at that time.
| Date/Time | Thumbnail | Dimensions | User | Comment | |
|---|---|---|---|---|---|
| current | 15:48, 16 September 2016 |  | 851 × 1,163 (61 KB) | Debra Tabron (talk | contribs) | Newell Figure 4. Comparison of tracer breakthrough (upper graph) and cleanup curves from advection-dispersion based (gray lines) and advection-diffusion based (black lines) solute transport |
- You cannot overwrite this file.
File usage
There are no pages that link to this file.