File:McCall Article 3 Figure 7.PNG
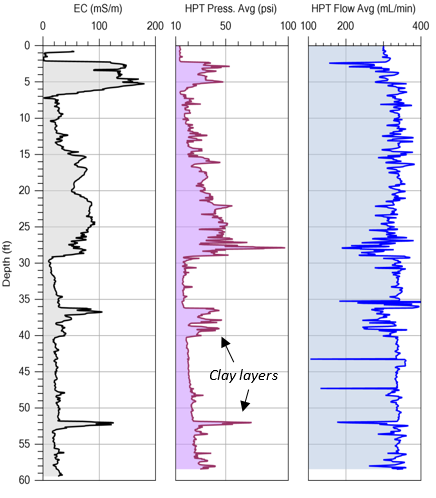
Revision as of 09:50, 29 August 2016 by Debra Tabron (talk | contribs) (Figure 7: An HPT log with EC on left, injection pressure in middle, and flow rate on right. Note good agreement between the EC and HPT pressure logs. Mostly coarse grained below 29 ft with 2 clay layers defined. See also Fig. 5.)
McCall_Article_3_Figure_7.PNG (436 × 498 pixels, file size: 75 KB, MIME type: image/png)
Figure 7: An HPT log with EC on left, injection pressure in middle, and flow rate on right. Note good agreement between the EC and HPT pressure logs. Mostly coarse grained below 29 ft with 2 clay layers defined. See also Fig. 5.
File history
Click on a date/time to view the file as it appeared at that time.
| Date/Time | Thumbnail | Dimensions | User | Comment | |
|---|---|---|---|---|---|
| current | 09:50, 29 August 2016 |  | 436 × 498 (75 KB) | Debra Tabron (talk | contribs) | Figure 7: An HPT log with EC on left, injection pressure in middle, and flow rate on right. Note good agreement between the EC and HPT pressure logs. Mostly coarse grained below 29 ft with 2 clay layers defined. See also Fig. 5. |
- You cannot overwrite this file.
File usage
The following page links to this file:
