File list
This special page shows all uploaded files.
| Date | Name | Thumbnail | Size | Description | Versions |
|---|---|---|---|---|---|
| 15:15, 18 November 2016 | Salter-Blanc-Contaminants Treated-Equation 4.PNG (file) | 9 KB | 1 | ||
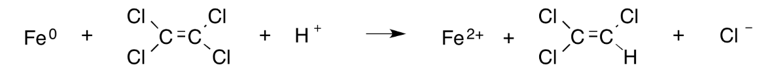
| 15:13, 18 November 2016 | Salter-Blanc-Chemistry-Equation 3.PNG (file) | 2 KB | 1 | ||
| 15:12, 18 November 2016 | Salter-Blanc-Chemistry-Equation 2.PNG (file) | 2 KB | 1 | ||
| 15:11, 18 November 2016 | Salter-Blanc-Chemistry-Equation 1.PNG (file) | 911 bytes | Saler-Blanc-chemistry-Equation 1 | 1 | |
| 15:08, 18 November 2016 | SalterBlanc Figure1 ZVI.png (file) |  |
48 KB | Figure 1. Overlap between areas of environmental technology related to ZVMs such as ZVI (reprinted with permission from Tratnyek et al. 2010 | 1 |
| 21:56, 15 November 2016 | Aziz-2002-Biochlor Natural Attenuation Decision Support System V2.2.pdf (file) | 471 KB | Aziz, C.E., C.J. Newell, and J.R. Gonzales (2002), BIOCHLOR Natural Attenuation Decision Support System Version 2.2 User’s Manual Addendum | 1 | |
| 21:16, 15 November 2016 | Aziz-2000-BIOCHLOR-Natural Attenuation Dec Support.pdf (file) | 541 KB | Aziz, C.E., C.J. Newell, J.R. Gonzales, P. Hass, T.P. Clement, and Y. Sun, (2000) BIOCHLOR Natural Attenuation Decision Support System User’s Manual Version 1.0, U.S. Environmental Protection Agency, EPA/600/R-00/008. | 1 | |
| 16:19, 14 November 2016 | Walsh-2007-Energetic Residues on Alaskan Training Ranges.pdf (file) | 3.41 MB | Walsh, M.E., Collins, C.M., Ramsey, C.A., Douglas, T.A., Bailey, R.N., Walsh, M.R., Hewitt, A.D. and Clausen, J.L., 2007. Energetic residues on Alaskan training ranges. US Army Engineer Research and Development Center, Cold Regions Research and Enginee... | 1 | |
| 20:12, 11 November 2016 | Walsh-Article 1-Table 5.PNG (file) |  |
28 KB | Table 5: Soil concentrations of DNT for propellant burn (mg/kg) | 1 |
| 20:10, 11 November 2016 | Walsh-Article 1-Table 3.PNG (file) |  |
59 KB | Table 3. Detonation efficiency descriptors used by CRREL. | 1 |
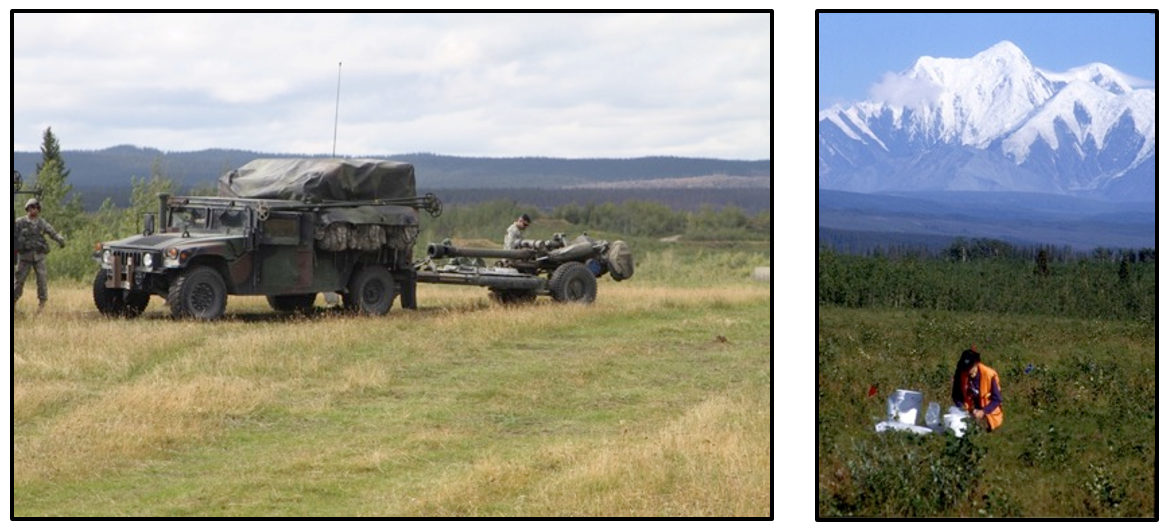
| 20:09, 11 November 2016 | Walsh-Article 1-Figure 5.PNG (file) |  |
1.25 MB | Figure 5. A towed howitzer at FP Sally, DTA. Soil sample labeling at FP Sally following artillery training. | 1 |
| 20:08, 11 November 2016 | Walsh-Article 1-Figure 4.PNG (file) |  |
570 KB | Figure 4. Burning of excess propellant | 1 |
| 20:06, 11 November 2016 | Walsh-Article 1-Figure 3.PNG (file) |  |
1.08 MB | Figure 3. Firing position tests: Anti-tank rocket (residues deposited primarily behind weapon) and tank (residues deposited in front of weapon) | 1 |
| 20:06, 11 November 2016 | Walsh-Article 1-Figure 2.PNG (file) |  |
678 KB | Figure 2. Post-detonation residues deposition footprint and sampling residues on snow-covered ice | 1 |
| 20:04, 11 November 2016 | Walsh-Article 1-Figure 1.PNG (file) |  |
1.13 MB | Figure 1. Range ordnance disposal operation. Blow-in-place (BIP) operations often result in significant energetics deposition. | 1 |
| 13:38, 11 November 2016 | No Author-Article 1-Table 1.PNG (file) |  |
7 KB | Table 1. Median lethal concentration of NTO to Ceriodaphnia (mg/L) | 1 |
| 21:27, 10 November 2016 | USAPCH-Lent-2012--Tox Study no. 87-XE-0DBP-10.pdf (file) | 4.38 MB | Found: Lent, E.M., Crouse, L.C., Hanna, T. and Wallace, S.M., 2012. The subchronic oral toxicity of 2, 4-dinitroanisole (DNAN) in rats (No. USAPHC-87-XE-0DBP-10). Army Public Health Command Aberdeen Proving Ground MD. | 1 | |
| 16:35, 10 November 2016 | Kennedy-2013-Dev. of Envl Health Criteria for Insensitive Munitions.pdf (file) | 1.94 MB | Kennedy AJ, Lounds CD, Melby NL, Laird JG, Winstead B, Brasfield SM, Johnson MS. 2013. Development of Environmental Health Criteria for Insensitive Munitions: Aquatic Ecotoxicological Exposures Using 2,4-Dnitroanisole. ERDC/EL TR-13-2, U.S. Army Corps... | 1 | |
| 14:39, 9 November 2016 | Favara-Article 1-Figure 3.PNG (file) |  |
220 KB | Figure 3. Relationship between the sustainable aspects (center), core elements (spokes), and BMPs (wheel tread. Reprinted, with permission, from E2876-13 Standard Guide for Integrating Sustainable Objectives into Cleanup, copyright ASTM International,... | 1 |
| 14:34, 9 November 2016 | Favara-Article 1-Figure 2.PNG (file) |  |
33 KB | Figure 2. Life-cycle phases of remediation projects and where footprint assessments and LCAs can be implemented. Reprinted, with permission, from E2893-16, Standard Guide for Greener Cleanups, copyright ASTM International, 100 Barr Harbor Drive, West C... | 1 |
| 14:29, 9 November 2016 | Favara-Article 1-Figure 1-Exhibit-2.jpg (file) |  |
997 KB | Figure 1. Comparison of linear versus holistic approach to integrating sustainability into projects (from Holland et al, 2011 | 1 |
| 21:33, 8 November 2016 | USNAVY-2016-Tech Memo TM-NAVFAC-EXWC-EV-1601.pdf (file) | 809 KB | US Navy. 2016. Technical Memorandum TM-NAVFAC-EXWC-EV-1601. Green and Sustainable Remediation Best Management Practices. | 1 | |
| 16:52, 8 November 2016 | USACE-2012-Evaluation of Consideration and inc. of GSR.pdf (file) | 5.4 MB | US Army Corp of Engineers (USACE), 2012. Evaluation of Consideration and Incorporation of Green and Sustainable Remediation (GSR) Practices in Army Environmental Remediation. | 1 | |
| 14:49, 8 November 2016 | ESTCP-2013-Quantifying Life Cycle envl Footprints...ER-201127.pdf (file) | 6.8 MB | ESTCP, 2013. Quantifying Life Cycle Environmental Footprints of Soil and Groundwater Remedies. ER-201127 | 1 | |
| 20:00, 7 November 2016 | BJohnson-Article 1-Figure 4.PNG (file) |  |
89 KB | Figure 4. Computed and measured groundwater concentrations of RDX at MW161 down gradient of Demolition Area 2, MMR, with upper (UCL) and lower (LCL) confidence limits for uncertainty of RDX degradation rate. | 1 |
| 19:59, 7 November 2016 | BJohnson-Article 1-Figure 3.PNG (file) |  |
95 KB | Figure 3. CSM as modeled in TREECS™ with Advanced Tier 2 option for Camp Pendleton, CA | 1 |
| 19:58, 7 November 2016 | BJohnson-Article 1-Figure 2.PNG (file) |  |
98 KB | Figure 2. Conceptual Site Model used with TREECS™ Advanced Tier 2 for the Zulu Impact Area (ZIA) and receiving waters, Camp Pendleton, CA. The area of interest (AOI) is the ZIA. | 1 |
| 19:57, 7 November 2016 | BJohnson-Article 1-Figure 1.PNG (file) |  |
434 KB | Figure 1. TREECS main screen as it appears for an application involving GIS data. | 1 |
| 18:18, 7 November 2016 | Johnson-2014a-Hydrology Model Formulation.ERDC.EL TR-14-2.pdf (file) | 562 KB | Johnson, B.E., and M.S. Dortch. 2014a. Hydrology model formulation within the Training Range Environmental Evaluation and Characterization System (TREECS™). ERDC/EL TR-14-2, U.S. Army Engineer Research and Development Center, Vicksburg, MS. | 1 | |
| 17:59, 7 November 2016 | Gerald-2012-User guide for applying the training range Evnl Eval.Char sys.pdf (file) | 4.76 MB | Gerald, J.A., B.E. Johnson, and M.S. Dortch. 2012. User guide for applying the Training Range Environmental Evaluation and Characterization System (TREECS™). ERDC/EL TR-12-16, U.S. Army Engineer Research and Development Center, Vicksburg, MS | 1 | |
| 15:28, 7 November 2016 | Dortch-2015-Modules for modeling firing range.pdf (file) | 600 KB | Dortch, M.S. and Gerald, J.A., 2015. Modules for modeling firing range best management practices within TREECS™ (No. ERDC/EL-TR-15-7). Engineer Research and Development Center Vicksburg MS Environmental Lab. | 1 | |
| 14:53, 7 November 2016 | Dortch-2014-Eval of time-varying hydrology...ERD-EL-CR-14-3.pdf (file) | 2.01 MB | Dortch, M.S. 2014. Evaluation of time-varying hydrology within the Training Range Environmental Evaluation and Characterization System (TREECS™). ERDC/EL CR-14-3, U.S. Army Engineer Research and Development Center, Vicksburg, MS. | 1 | |
| 20:59, 4 November 2016 | Dortch-2013b-Modeling firing range...ERDC-EL TR-13-6.pdf (file) | 1.05 MB | Dortch, M.S., B.E. Johnson, and J.A. Gerald. 2013b. Modeling firing range best management practices with TREECS™. ERDC/EL TR-13-6, U.S. Army Engineer Research and Development Center, Vicksburg, MS. | 1 | |
| 20:45, 4 November 2016 | Dortch-2012-Extension of cap for the Tier 1 and 2 approaches Training range ERDC-EL-TR-12-11.pdf (file) | 510 KB | Dortch, M.S., B.E. Johnson, and J.A. Gerald. 2012. Extension of capabilities for the Tier 1 and Tier 2 Approaches within the Training Range Environmental Evaluation and Characterization System (TREECS™). ERDC/EL TR-12-11, U.S. Army Engineer Research... | 1 | |
| 20:26, 4 November 2016 | Dortch-2011a-Methods for Tier 2 modeling Training Range ERDC-EL-TR112.pdf (file) | 1.94 MB | Dortch, M.S., B.E. Johnson, Z. Zhang, and J.A. Gerald. 2011a. Methods for Tier 2 modeling within the Training Range Environmental Evaluation and Characterization System (TREECS™). ERDC/EL TR-11-2, U.S. Army Engineer Research and Development Center, V... | 1 | |
| 20:21, 4 November 2016 | Dortch-2009-Methods for Tier 1 modeling training range ERCDC-EL-TR0911.pdf (file) | 1.71 MB | Dortch, M.S., J.A. Gerald, and B.E. Johnson. 2009. Methods for Tier 1 modeling with the Training Range Environmental Evaluation and Characterization System. ERDC/EL TR-09-11, U.S. Army Engineer Research and Development Center, Vicksburg, MS. | 1 | |
| 18:10, 4 November 2016 | Davis-Solubility+Product+Constant-Kathryn Rashe, Lisa Peterson.pdf (file) | 117 KB | U.C. Davis/ Solubility Product Constant. Contributors. Kathryn Rashe, Lisa Peterson | 1 | |
| 17:39, 4 November 2016 | Davis-The+Equilibrium+Constant-Heather Voigt.pdf (file) | 140 KB | U.C. Davis, ChemWiki. The Equilibrium Constant. Contributor: Heather Voigt. Updated: July 12, 2016. | 1 | |
| 14:03, 4 November 2016 | Denham-Article 2-Figure 2.PNG (file) |  |
30 KB | Figure 2: Mineral surface exchanging hydrogen ions with varying pH | 1 |
| 14:02, 4 November 2016 | Denham-Article 2-Figure 1.PNG (file) |  |
82 KB | Figure 1: Aqueous speciation of uranium (diagram produced with The Geochemist’s Workbench® | 1 |
| 14:00, 4 November 2016 | Denham-Article 2-Equation 1.PNG (file) |  |
2 KB | 1 | |
| 17:30, 3 November 2016 | NABIR-2003-Bioremediation of Metals and Radionuclides.pdf (file) | 2.75 MB | NABIR, 2003. Bioremediation of Metals and Radionuclides – What It Is And How It Works. LBNL-42595, Lawrence Berkeley National Laboratory, for the Natural and Accelerated Bioremediation Research Program, Office of Science, U.S. Department of Energy | 1 | |
| 19:16, 1 November 2016 | Denham-Article 1-Figure 1. PNG.PNG (file) |  |
82 KB | Figure 1: Uranium’s complicated aqueous speciation (diagram produced with The Geochemist’s Workbench® PCO2 = 0.01 atm., [Ca] = 10 (mg/L). | 1 |
| 20:03, 26 October 2016 | Palaia-Article 1-Fraction 1.2.PNG (file) |  |
567 bytes | 1 | |
| 20:02, 26 October 2016 | Palaia-Article 1-Fraction 1.1.PNG (file) |  |
696 bytes | 1 | |
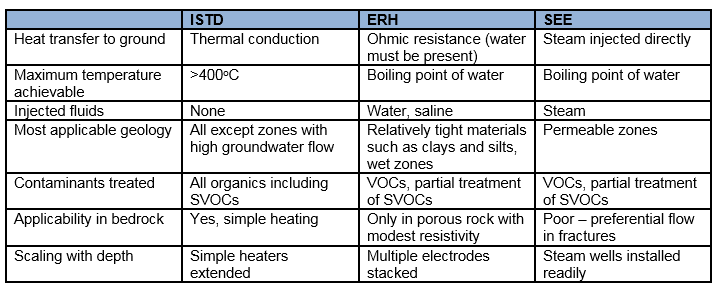
| 18:09, 26 October 2016 | Heron-Article 1. Table 1.PNG (file) |  |
29 KB | Table 1. Characteristics of the three main thermal technologies. | 1 |
| 18:04, 26 October 2016 | Heron-Article 1. Figure 3.PNG (file) |  |
66 KB | Figure 3. Properties of PCE, TCE and water as a function of temperature. Changes in PCE and TCE properties with increased temperature facilitate contaminant recovery as a vapor. | 1 |
| 18:03, 26 October 2016 | Heron-Article 1. Figure 2.PNG (file) |  |
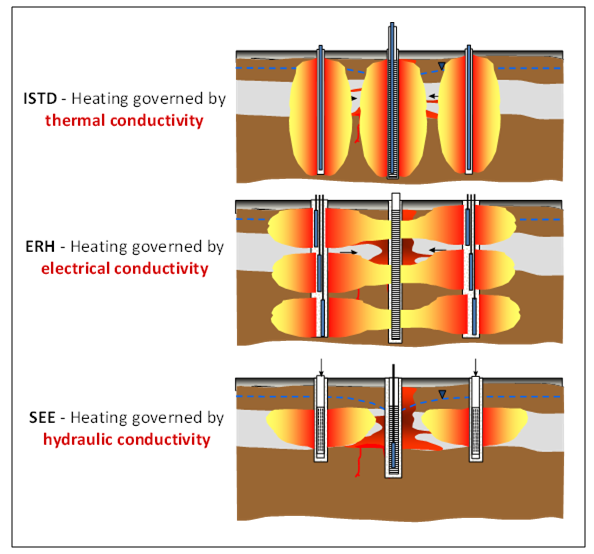
108 KB | Figure 2. The Three Most Commonly Used In Situ Thermal Technologies. (See text for abbreviation definitions) | 1 |
| 18:02, 26 October 2016 | Heron-Article 1. Figure 1.PNG (file) |  |
65 KB | Figure 1. Candidate Site for ISTR Application with Significant NAPL Source Material | 1 |
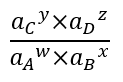
| 19:44, 25 October 2016 | Palaia-Article 1-Equation 2.PNG (file) | 2 KB | 1 |