Difference between revisions of "Direct Push Logging"
m (1 revision imported) |
m (1 revision imported) |
||
| Line 26: | Line 26: | ||
[[File:McCall Article 3 Figure 4.PNG|250px|thumbnail|left|Figure 4. A Wenner array probe (top) and a dipole array built into an MIP probe.]] | [[File:McCall Article 3 Figure 4.PNG|250px|thumbnail|left|Figure 4. A Wenner array probe (top) and a dipole array built into an MIP probe.]] | ||
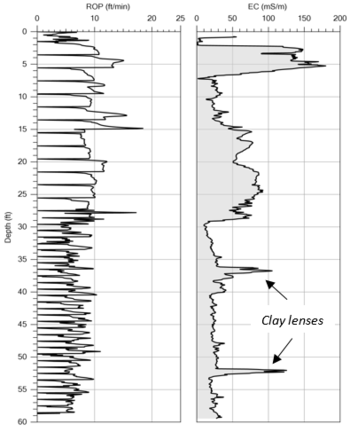
[[File:McCall Article 3 Figure 5.PNG|350px|thumbnail|right|Figure 5. A typical EC log with rate of penetration (ROP) plotted on left and bulk formation EC on right. The decrease in EC and ROP at ~29 ft indicates transition to coarser grained materials (sands).]] | [[File:McCall Article 3 Figure 5.PNG|350px|thumbnail|right|Figure 5. A typical EC log with rate of penetration (ROP) plotted on left and bulk formation EC on right. The decrease in EC and ROP at ~29 ft indicates transition to coarser grained materials (sands).]] | ||
| − | Electrical conductivity (EC) and it’s inverse, resistivity, have been used for petroleum and mineral resources investigations<ref>Dobrin, Milton B., 1976. Introduction to geophysical prospecting. McGraw-Hill, New York, NY. ISBN 978-0070171954</ref> and groundwater resource assessments<ref>Keys, W. Scott, 1997. A practical guide to borehole geophysics in environmental investigations. CRC Press/Lewis Publishers, Boca Raton, FL.</ref> for many years. Conversely, soil scientists have typically used EC for determining the salinity of soils<ref>Rhoades, J.D. and van Schilfgaarde, J., 1976. An electrical conductivity probe for determining soil salinity. Soil Science Society of America Journal, 40(5), 647-651. [http://dx.doi.org/10.2136/sssaj1976.03615995004000050016x doi:10.2136/sssaj1976.03615995004000050016x]</ref>. EC logging tools for DP application were developed more recently<ref name= "McCall2006"/><ref name= "Christy1994">Christy, C.D., Christy, T.M. and Wittig, V., 1994, May. A percussion probing tool for the direct sensing of soil conductivity. Technical Paper No. 94-100, pp16. [ | + | Electrical conductivity (EC) and it’s inverse, resistivity, have been used for petroleum and mineral resources investigations<ref>Dobrin, Milton B., 1976. Introduction to geophysical prospecting. McGraw-Hill, New York, NY. ISBN 978-0070171954</ref> and groundwater resource assessments<ref>Keys, W. Scott, 1997. A practical guide to borehole geophysics in environmental investigations. CRC Press/Lewis Publishers, Boca Raton, FL.</ref> for many years. Conversely, soil scientists have typically used EC for determining the salinity of soils<ref>Rhoades, J.D. and van Schilfgaarde, J., 1976. An electrical conductivity probe for determining soil salinity. Soil Science Society of America Journal, 40(5), 647-651. [http://dx.doi.org/10.2136/sssaj1976.03615995004000050016x doi:10.2136/sssaj1976.03615995004000050016x]</ref>. EC logging tools for DP application were developed more recently<ref name= "McCall2006"/><ref name= "Christy1994">Christy, C.D., Christy, T.M. and Wittig, V., 1994, May. A percussion probing tool for the direct sensing of soil conductivity. Technical Paper No. 94-100, pp16. [http://www.environmentalrestoration.wiki/images/e/ee/Christy-1994-A_PercussionProb_Tool_for_Diret_Sensing_of_Soil_Conductivity.pdf Report pdf]</ref> and are sometimes pushed statically with a heavy CPT truck or advanced dynamically with smaller percussion probing machines. Often EC probes are designed with four evenly spaced electrodes (Wenner array) while many other DP logging tools will include a simple dipole array (Fig. 4). The volume of formation measured is proportional to the length of the EC array. While a Wenner array averages over a larger volume of formation, a dipole array can detect smaller features, such as thin clay layers within a large sandy aquifer. In fresh water formations, the bulk electrical conductivity of the formation is most often controlled by clay content. Clays typically have a higher electrical conductance than silts and sands so that higher EC values usually correlate with increased clay content and lower permeability<ref name= "McCall2006"/><ref name= "Schulmeister2003">Schulmeister, M.K., Butler, J.J., Healey, J.M., Zheng, L., Wysocki, D.A. and McCall, G.W., 2003. Direct‐push electrical conductivity logging for high‐resolution hydrostratigraphic characterization. Groundwater Monitoring & Remediation, 23(3), 52-62. [http://dx.doi.org/10.1111/j.1745-6592.2003.tb00683.x doi: 10.1111/j.1745-6592.2003.tb00683.x]</ref>. However, some clays do not exhibit high EC. Also, when ionic contaminants or ionic remediation fluids are present, they may cause a very high bulk formation EC, masking variations in natural formation EC readings. EC logs have been obtained to depths exceeding 100 ft (30 m) with DP methods in many unconsolidated formations. Direct push EC logs have been found to be useful for many geo-environmental investigations<ref name= "McCall2006"/><ref name= "Christy1994"/><ref name= "Schulmeister2003"/><ref>Wilson, J.T., Ross, R.R., Acree, S., 2005. Using direct‐push tools to map hydrostratigraphy and predict MTBE plume diving. Groundwater Monitoring & Remediation, 25(3), 93-102. [http://dx.doi.org/10.1111/j.1745-6592.2005.00031.x doi: 10.1111/j.1745-6592.2005.00031.x]</ref><ref>Beck, F.P., Clark, P.J. and Puls, R.W., 2000. Location and characterization of subsurface anomalies using a soil conductivity probe. Groundwater Monitoring & Remediation, 20(2), 55-59. [http://onlinelibrary.wiley.com/doi/10.1111/j.1745-6592.2000.tb00265.x/full doi:10.1111/j.1745-6592.2000.tb00265.x]</ref><ref>Sellwood, S.M., Healey, J.M., Birk, S. and Butler, J.J., 2005. Direct‐push hydrostratigraphic profiling: coupling electrical logging and slug tests. Ground water, 43(1), 19-29. [http://dx.doi.org/10.1111/j.1745-6584.2005.tb02282.x doi: 10.1111/j.1745-6584.2005.tb02282.x]</ref><ref>Harrington, G.A. and Hendry, M.J., 2006. Using direct‐push EC logging to delineate heterogeneity in a clay‐rich aquitard. Groundwater Monitoring & Remediation, 26(1), 92-100. [http://dx.doi.org/10.1111/j.1745-6592.2006.00063.x doi:10.1111/j.1745-6592.2006.00063.x]</ref><ref>U.S. Environmental Protection Agency, 2000. Innovations in site characterization: geophysical investigation at hazardous waste sites. EPA-542-R-00-003. Office of Solid Waste and Emergency Response (5102G), Washington, D.C. [http://www.environmentalrestoration.wiki/images/b/b4/USEPA-2000-Innovations_in_site_characterization.pdf Report pdf]</ref>. The logs provide data on bulk formation EC at the inch scale versus depth (Fig. 5). They usually include a speed graph which can help interpret formation changes. EC logs may be used to locate brine plumes or seawater intrusion and help to define the distribution of ionic injectates (e.g. [[wikipedia: Sodium persulfate | sodium persulfate]]) used for contaminant remediation. An EC array is often run in tandem with other DP logging sensors to provide additional information on subsurface lithology. |
===Hydraulic Profiling Tool (HPT)=== | ===Hydraulic Profiling Tool (HPT)=== | ||
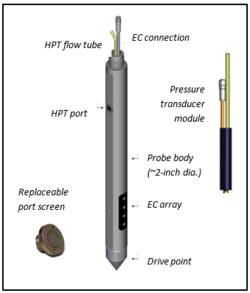
[[File:McCall Article 3 Figure 6.PNG|250px|thumbnail|left|Figure 6. Schematic of an HPT probe.]] | [[File:McCall Article 3 Figure 6.PNG|250px|thumbnail|left|Figure 6. Schematic of an HPT probe.]] | ||
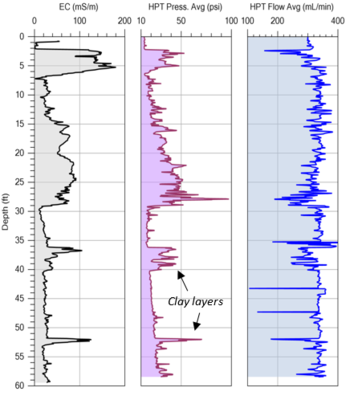
[[File:McCall Article 3 Figure 7.PNG|350px|thumbnail|right|Figure 7. An HPT log with EC on left, injection pressure in middle, and flow rate on right. Note good agreement between the EC and HPT pressure logs. Mostly coarse grained below 29 ft with 2 clay layers defined. See also Fig. 5.]] | [[File:McCall Article 3 Figure 7.PNG|350px|thumbnail|right|Figure 7. An HPT log with EC on left, injection pressure in middle, and flow rate on right. Note good agreement between the EC and HPT pressure logs. Mostly coarse grained below 29 ft with 2 clay layers defined. See also Fig. 5.]] | ||
| − | Formation [[wikipedia: Permeability (earth sciences) | permeability]] is important in controlling subsurface contaminant migration. Permeable zones that are continuous form migration pathways for contaminants to reach receptors. Recent studies have found that clay-rich, low permeability zones may behave as sinks for many organic contaminants which are later released by back diffusion<ref>Chapman, S.W. and Parker, B.L., 2005. Plume persistence due to aquitard back diffusion following dense nonaqueous phase liquid source removal or isolation. Water Resources Research, 41, W12411. [http://dx.doi.org/10.1029/2005wr004224 doi:10.1029/2005WR004224]</ref><ref>Hadley, P.W. and Newell, C., 2014. The new potential for understanding groundwater contaminant transport. Groundwater, 52(2), 174-186. [http://dx.doi.org/10.1111/gwat.12135 doi:10.1111/gwat.12135]</ref> greatly extending the life of the contaminant plume. The HPT probe<ref>Geoprobe, 2013. Geoprobe® Hydraulic Profiling Tool (HPT) System, Standard Operating Procedure. Technical Bulletin No. MK3137. Kejr, Inc., Salina, KS.</ref><ref>Geoprobe, 2011. Application of the Geoprobe® HPT logging system for geo-environmental investigations. Technical Bulletin No. MK3184. [ | + | Formation [[wikipedia: Permeability (earth sciences) | permeability]] is important in controlling subsurface contaminant migration. Permeable zones that are continuous form migration pathways for contaminants to reach receptors. Recent studies have found that clay-rich, low permeability zones may behave as sinks for many organic contaminants which are later released by back diffusion<ref>Chapman, S.W. and Parker, B.L., 2005. Plume persistence due to aquitard back diffusion following dense nonaqueous phase liquid source removal or isolation. Water Resources Research, 41, W12411. [http://dx.doi.org/10.1029/2005wr004224 doi:10.1029/2005WR004224]</ref><ref>Hadley, P.W. and Newell, C., 2014. The new potential for understanding groundwater contaminant transport. Groundwater, 52(2), 174-186. [http://dx.doi.org/10.1111/gwat.12135 doi:10.1111/gwat.12135]</ref> greatly extending the life of the contaminant plume. The HPT probe<ref>Geoprobe, 2013. Geoprobe® Hydraulic Profiling Tool (HPT) System, Standard Operating Procedure. Technical Bulletin No. MK3137. Kejr, Inc., Salina, KS.</ref><ref>Geoprobe, 2011. Application of the Geoprobe® HPT logging system for geo-environmental investigations. Technical Bulletin No. MK3184. [http://www.environmentalrestoration.wiki/images/b/bb/Geoprobe-2011-Application_of_the_Geoprobe_HPT_Logging_Sys_for_Geo_Invest..pdf Report pdf]</ref><ref>ASTM International, 2015. Proposed standard WK48024. Standard practice for direct push hydraulic injection logging for relative permeability and lithology with depth. [http://www.astmnewsroom.org/default.aspx?pageid=4070 ASTM International Site]</ref> and similar devices<ref>Dietrich, P., Butler, J.J. and Faiß, K., 2008. A rapid method for hydraulic profiling in unconsolidated formations. Ground Water, 46(2), 323-328. [http://dx.doi.org/10.1111/j.1745-6584.2007.00377.x doi: 10.1111/j.1745-6584.2007.00377.x]</ref><ref>Reiffsteck, P., Dorbani, B., Haza-Rozier, E. and Fry, J., 2010, May. A new hydraulic profiling tool including CPT measurements. Presented at the 2nd international symposium on cone penetration testing (CPT’10). Volume 2: Equipment and Procedures, Paper No. 1-11. [http://www.environmentalrestoration.wiki/images/e/e9/Reiffsteck-2010-A_New_Hydraulic_Profiling_Tool_including_CPT_Measurements.pdf Report pdf]</ref><ref name= "Pitken2004">Pitken, S., et. al., 2004. Evaluation of the waterloo profiler as a dynamic site investigation tool. In Proceedings of the Fourth International conference on Remediation of Chlorinated and Recalcitrant Compounds, Paper 1B-07, A.R. Gavaskar and A.S.C. Chen (Eds.), Battelle Press, Columbus, OH.</ref><ref>Liu, Gaisheng, Butler, J. J., Roulet, E., and Knobbe, S., 2012. Hydraulic conductivity profiling with direct push methods. Grundwasser, 17(1), 19-29. [http://dx.doi.org/10.1007/s00767-011-0182-9 doi: 10.1007/s00767-011-0182-9]</ref> were developed to better understand formation permeability and the distribution of permeable and low permeability zones in unconsolidated formations. While advancing the HPT probe at approximately 2 cm/sec, water is injected at a rate of about 300 ml/min through a small screened port on the side of the probe (Fig. 6). A pressure transducer located just above the probe measures the pressure required to inject water into the formation. The injection pressure and flow rate are plotted versus depth to provide a log of relative formation permeability (Fig. 7). Interpretation of the HPT log is relatively simple with higher HPT pressure indicating lower permeability and vice versa, at a constant flow rate. HPT probes typically include an EC array. Under most field conditions in fresh water formations, the EC log and HPT pressure log will display a similar trend. Sometimes the EC and HPT pressure logs do not correlate. This is especially true when high concentrations of ionic contaminants are present in the groundwater. This behavior makes the HPT-EC probe useful for tracking brine plumes, seawater intrusion, and the distribution of ionic remediation injectates. Some of these logging devices can be used to collect groundwater samples at multiple depths during logging<ref name= "Pitken2004"/><ref>McCall, W., Christy, T., and Knabach. M.E., in review. Applying the HPT-GWS for hydrostratigraphy, water quality and aquifer recharge investigations. Groundwater Monitoring & Remediation.</ref>. Pneumatic slug testing<ref>Geoprobe, 2014. Geoprobe® Pneumatic Slug Test Kit (GW1600), Installation and Operation Instructions for the USB System. Instructional Bulletin No. MK3195.</ref><ref>American Society for Testing & Materials (ASTM) International, 2015. D7242. ASTM International. D7242. Standard practice for field pneumatic slug (instantaneous change in head) tests to determine hydraulic properties of aquifers with direct push groundwater samplers. West Conshohocken, PA, USA.</ref> of DP groundwater samplers may be used to confirm HPT permeability data and obtain quantitative data for hydraulic conductivity. |
===Membrane Interface Probe (MIP)=== | ===Membrane Interface Probe (MIP)=== | ||
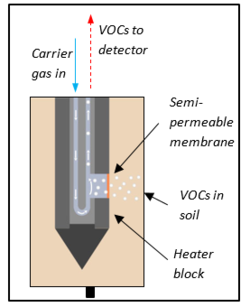
[[File:McCall Article 3 Figure 8.PNG|250px|thumbnail|left|Figure 8. Schematic of MIP depicting principles of operation.]] | [[File:McCall Article 3 Figure 8.PNG|250px|thumbnail|left|Figure 8. Schematic of MIP depicting principles of operation.]] | ||
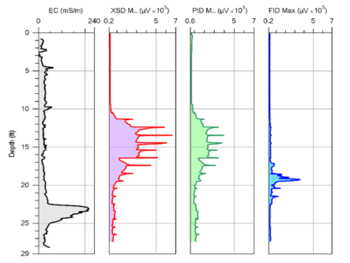
[[File:McCall Article 3 Figure 9.PNG|350px|thumbnail|right|Figure 9. An MIP log left to right: EC log, XSD, PID and FID detector responses versus depth identifying presence and levels of VOC contamination.]] | [[File:McCall Article 3 Figure 9.PNG|350px|thumbnail|right|Figure 9. An MIP log left to right: EC log, XSD, PID and FID detector responses versus depth identifying presence and levels of VOC contamination.]] | ||
| − | The MIP was developed for investigation of volatile organic compounds (VOC) and light petroleum fuel contaminated sites in unconsolidated formations<ref name= "Christy1996">Christy, T.M., 1996. A permeable membrane sensor for the detection of volatile compounds in soil. Presented at the National Groundwater Association Outdoor Action Conference, Las Vegas, NV. May.</ref><ref name= "ASTM2015D7352">American Society of Testing and Materials (ASTM) International, 2015. D7352. Standard practice for direct push technology for volatile contaminant logging with the membrane interface probe (MIP). ASTM International, West Conshohocken, PA, USA.</ref><ref name= "Geoprobe2003">Geoprobe, 2003. Geoprobe® Membrane interface probe (MIP) standard operating procedure, Technical Bulletin No. MK3010. Revised, April, 2010. [ | + | The MIP was developed for investigation of volatile organic compounds (VOC) and light petroleum fuel contaminated sites in unconsolidated formations<ref name= "Christy1996">Christy, T.M., 1996. A permeable membrane sensor for the detection of volatile compounds in soil. Presented at the National Groundwater Association Outdoor Action Conference, Las Vegas, NV. May.</ref><ref name= "ASTM2015D7352">American Society of Testing and Materials (ASTM) International, 2015. D7352. Standard practice for direct push technology for volatile contaminant logging with the membrane interface probe (MIP). ASTM International, West Conshohocken, PA, USA.</ref><ref name= "Geoprobe2003">Geoprobe, 2003. Geoprobe® Membrane interface probe (MIP) standard operating procedure, Technical Bulletin No. MK3010. Revised, April, 2010. [http://www.environmentalrestoration.wiki/images/6/63/Geoprobe-2003-Membrane_Interface_Probe_SOP.pdf Report pdf]</ref>. The MIP probe has a semi-permeable membrane on one side (Fig. 8) that allows VOCs to pass through, while minimizing the movement of water across the membrane. A heater block on the probe face enhances movement of VOCs across the membrane and into a nitrogen carrier gas stream. The carrier gas and contained VOCs travel up the trunkline to gas phase detectors at the surface. Detectors commonly used with the MIP include a photo-ionization detector (PID), flame ionization detector (FID) and a halogen specific detector (XSD). All three detectors can run simultaneously<ref name= "Geoprobe2003"/>. The PID is particularly sensitive to aromatic hydrocarbons like benzene and toluene, but will also detect the double bonds present in many chlorinated hydrocarbons like trichloroethylene (TCE) and perchloroethylene (PCE)<ref>Driscoll, J.N. and Clarici, J.B., 1976. Ein neuer photoionisationsdetektor für die gas-chromatographie. Chromatographia, 9(11), 567-570. [http://dx.doi.org/10.1007/bf02275964 doi: 10.1007/BF02275964]</ref><ref>Haag, W. and Wrenn, C., 2006. The PID Handbook - Theory and applications of direct-reading photoionization detectors (PIDs). RAE Systems, 2nd Ed., San Jose, CA. ISBN 9780976816218</ref>. The FID is effective at detecting fuel hydrocarbons (e.g. hexane and octane) and other alkanes and aromatic hydrocarbons<ref>Skoog, Douglas A., Holler, F.J., Crouch, S.R., 2007. Principles of instrumental analysis. 6th edition. United States: Thomson Brooks/Cole, 2007. ISBN 978-0495012016 </ref><ref>Halász, I. and Schneider, W., 1961. Quantitative gas chromatographic analysis of hydrocarbons with capillary column and flame ionization detector. Analytical Chemistry, 33(8), 978-982. [http://dx.doi.org/10.1021/ac60176a034 doi: 10.1021/ac60176a034]</ref>. The XSD is designed to detect chlorinated VOCs like dichloroethene (DCE), TCE and PCE<ref>OI Analytical, 2001. Using the halogen specific detector (XSDTM) as an alternative to the ELCD in USEPA Methods: Presented at the 2001 Pittsburgh Conference on Analytical Chemistry and Applied Spectroscopy, New Orleans, LA. [http://www.environmentalrestoration.wiki/images/0/00/OI_Analytical-2001-1656_appl_USEPA_Halogen_XSDvsELCD.pdf Report pdf]</ref>. The MIP does not provide for separation of analytes by chromatography for specificity but provides for total VOC detection<ref name= "Christy1996"/><ref name= "ASTM2015D7352"/>. The probe is advanced in one foot (~30 cm) increments across zones of contamination, at each depth increment the probe advancement is halted for about one minute<ref name= "ASTM2015D7352"/><ref name= "Geoprobe2003"/>. This allows time for VOCs to cross the membrane and be swept up the trunkline to the detectors at the surface. This results in peaks in the detector response when contaminants are present (Fig. 9). The scale of the detector response is proportional to the level of contamination, with higher responses indicating more contamination. Several factors influence the MIP response such as formation grain size, organic carbon content, moisture content, and the analytes affinity to partition between the solid, liquid and gas phases. Thus, MIP logs provide a semi-quantitative indication of concentration<ref name= "Christy1996"/><ref name= "ASTM2015D7352"/>. A dipole electrical conductivity array is included near the MIP probe end to give information about formation lithology. The MIP and hydraulic profiling tool (HPT) also have been combined into one probe. This combination allows investigators to look at relative formation permeability along with VOC contaminant distribution<ref name= "McCall2014">McCall, W., Christy, T.M., Pipp, D., Terkelsen, M., Christensen, A., Weber, K. and Engelsen, P., 2014. Field application of the combined membrane‐interface probe and hydraulic profiling tool (MiHpt). Groundwater Monitoring & Remediation, 34(2), 85-95. [http://onlinelibrary.wiley.com/doi/10.1111/gwmr.12051/abstract doi: 10.1111/gwmr.12051]</ref>. Studies have been done to evaluate MIP operation and detection of DNAPLs<ref>Costanza, J. and Davis, W.M., 2000. Rapid detection of volatile organic compounds in the subsurface by membrane introduction into a direct sampling ion‐trap mass spectrometer. Field Analytical Chemistry & Technology, 4(5), 246-254. [http://onlinelibrary.wiley.com/doi/10.1002/1520-6521(2000)4:5%3C246::AID-FACT4%3E3.0.CO;2-W/abstract doi: 10.1002/1520-6521(2000)4:5<246::AID-FACT4>3.0.CO;2-W]</ref><ref>McAndrews, B., Heinze, K. and DiGuiseppi, W., 2003. Defining TCE plume source areas using the membrane interface probe (MIP). Soil and Sediment Contamination, 12(6), 799-813. [http://dx.doi.org/10.1080/714037716 doi: 10.1080/714037716]</ref><ref>Adamson, D.T., Chapman, S., Mahler, N., Newell, C., Parker, B., Pitkin, S., Rossi, M. and Singletary, M., 2014. Membrane Interface Probe Protocol for Contaminants in Low‐Permeability Zones. Groundwater, 52(4), 550-565. [http://dx.doi.org/10.1111/gwat.12085 doi: 10.1111/gwat.12085]</ref><ref>Griffin, T.W. and Watson, K.W., 2002. A comparison of field techniques for confirming dense nonaqueous phase liquids. Groundwater Monitoring & Remediation, 22(2), 48-59. [http://dx.doi.org/10.1111/j.1745-6592.2002.tb00312.x doi:10.1111/j.1745-6592.2002.tb00312.x]</ref><ref>Ravella, M., R.J. Fiacco, Jr., Frazier D. Wanty, and L. Burkhardt, 2007. Application of the membrane interface probe (MIP) to delineate subsurface DNAPL contamination. Environmental Engineer: Applied Research and Practice 1.</ref><ref>Bumberger, J., Radny, D., Berndsen, A., Goblirsch, T., Flachowsky, J. and Dietrich, P., 2012. Carry‐over effects of the membrane interface probe. Groundwater, 50(4), 578-584. [http://dx.doi.org/10.1111/j.1745-6584.2011.00879.x doi:10.1111/j.1745-6584.2011.00879.x ]</ref>. |
===Optical Imaging Profiler (OIP)=== | ===Optical Imaging Profiler (OIP)=== | ||
Revision as of 17:24, 3 May 2018
Direct push (DP) technology can be used to advance a variety of logging tools into the subsurface to provide high-resolution information on vertical variations in soil and unconsolidated formation properties. Commonly used tools provide qualitative and/or quantitative indicators of soil strength (cone penetration test (CPT)), salinity and/or clay content (electrical conductivity (EC)), permeability (hydraulic profiling tool (HPT)), levels of volatile organic chemicals (membrane interface probe), and fuel related hydrocarbons as non-aqueous phase liquids (NAPL) (optical imaging profiler (OIP)).
Related Article(s):
CONTRIBUTOR(S): Wesley McCall, M.S., P.G. and Tom Christy, P.E.
Key Resource(s):
Introduction
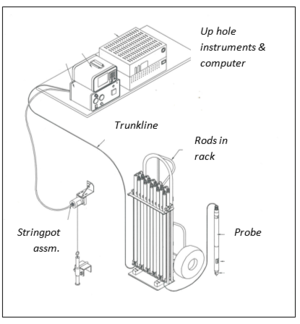
DP logs are run in unconsolidated materials, often to depths of 50 ft [15 m] and depths of 100+ ft [30+ m] may be achieved under amenable conditions. The first logging tool for DP application was the cone penetration tool, which was developed in the 1930s for geotechnical applications[2]. Several new DP logging tools have been developed since the 1980s focused primarily on geo-environmental investigation needs[1][3]. These tools are pushed or driven into virgin (no pre-existing borehole) formation to perform logging of various physical and chemical properties of the formation. A string pot or similar device, is used to track the depth of the probe. Most of these logging systems have several features in common (Fig. 1). The probe provides an interface between the measurement device and the formation being logged. The measurement device may consist of electrodes, a semi-permeable membrane, a screen, load cells or transducers for measurement of pressures, or other devices. Some probes have an optical window to allow for illumination of the formation with visible light for photos or video or illumination with ultra-violet (UV) light to monitor for fluorescence of some organic compounds. There is often a wiring cavity immediately above the probe where wiring and plumbing connections are made to the trunkline. The trunkline is a cable with plastic cladding that contains all of the electrical wiring and any tubing for fluid flows. For efficiency, the trunkline is pre-strung through all of the drive rods before any tooling is advanced into the subsurface. The top end of the trunkline is usually attached to an analog-to-digital instrument that converts the analog signals from the probe downhole to digital signal for output to software on a laptop computer for live-time viewing and saving data. When spaced across the site appropriately the DP log data may be used to develop high resolution site models for the parameter(s) investigated.
Cone Penetration Testing (CPT)
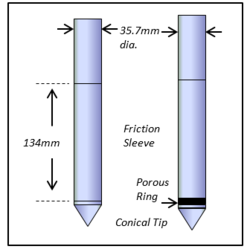
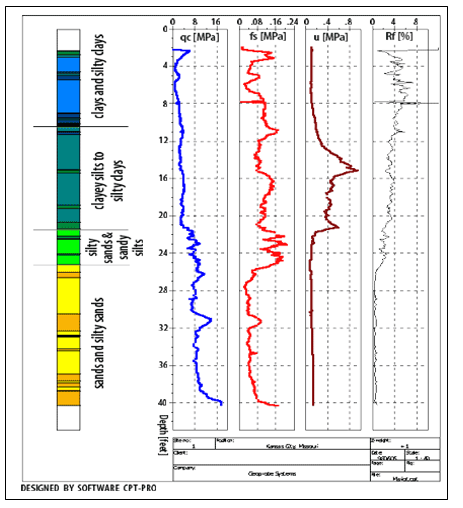
CPT tests are primarily used to assess soil strength or bearing capacity for foundations. More recent work has led to use of CPT data for soil classification[4][5] and also for environmental investigations[6][7], where it may be used to understand unconsolidated formation stratigraphy. The cone is advanced at approximately 2 cm/sec for logging. Often a large truck weighing 10 tons or more is used to advance the cone. However, smaller vehicles including DP track machines may use soil anchors to provide resistance for pushing the cone. The modern cone penetrometer is designed with a conical tip and a friction sleeve (Fig. 2). A load cell behind the conical tip measures the tip resistance (qc) required to push the cone through unconsolidated materials. A separate load cell behind the sleeve measures the frictional force exerted on the sleeve (fs) as the probe is advanced. Logs obtained using tip resistance and sleeve friction data are designated as CPT logs. A porous ring may be placed behind the point so that pore water pressure can be measured with a pressure transducer. This device is called a piezocone and logs obtained with this system are called CPTu logs. The pore pressure data helps with determining soil type and also is used to correct tip resistance. When advancing a piezocone the operator may stop probe advancement and perform a pressure dissipation test. The pressure dissipation test may be used to obtain estimates of local hydraulic conductivity[5]. CPTu logs typically display data plots of tip resistance (qc), sleeve friction (fs), and pore pressure (u). The friction ratio (Rf) is often used in classifying the soils and some CPT software programs will provide a soil classification log along with the digital data (Fig. 3).
Electrical Conductivity (EC)
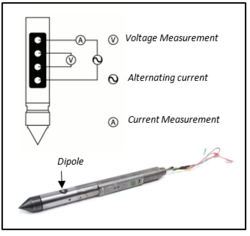
Electrical conductivity (EC) and it’s inverse, resistivity, have been used for petroleum and mineral resources investigations[8] and groundwater resource assessments[9] for many years. Conversely, soil scientists have typically used EC for determining the salinity of soils[10]. EC logging tools for DP application were developed more recently[1][11] and are sometimes pushed statically with a heavy CPT truck or advanced dynamically with smaller percussion probing machines. Often EC probes are designed with four evenly spaced electrodes (Wenner array) while many other DP logging tools will include a simple dipole array (Fig. 4). The volume of formation measured is proportional to the length of the EC array. While a Wenner array averages over a larger volume of formation, a dipole array can detect smaller features, such as thin clay layers within a large sandy aquifer. In fresh water formations, the bulk electrical conductivity of the formation is most often controlled by clay content. Clays typically have a higher electrical conductance than silts and sands so that higher EC values usually correlate with increased clay content and lower permeability[1][12]. However, some clays do not exhibit high EC. Also, when ionic contaminants or ionic remediation fluids are present, they may cause a very high bulk formation EC, masking variations in natural formation EC readings. EC logs have been obtained to depths exceeding 100 ft (30 m) with DP methods in many unconsolidated formations. Direct push EC logs have been found to be useful for many geo-environmental investigations[1][11][12][13][14][15][16][17]. The logs provide data on bulk formation EC at the inch scale versus depth (Fig. 5). They usually include a speed graph which can help interpret formation changes. EC logs may be used to locate brine plumes or seawater intrusion and help to define the distribution of ionic injectates (e.g. sodium persulfate) used for contaminant remediation. An EC array is often run in tandem with other DP logging sensors to provide additional information on subsurface lithology.
Hydraulic Profiling Tool (HPT)
Formation permeability is important in controlling subsurface contaminant migration. Permeable zones that are continuous form migration pathways for contaminants to reach receptors. Recent studies have found that clay-rich, low permeability zones may behave as sinks for many organic contaminants which are later released by back diffusion[18][19] greatly extending the life of the contaminant plume. The HPT probe[20][21][22] and similar devices[23][24][25][26] were developed to better understand formation permeability and the distribution of permeable and low permeability zones in unconsolidated formations. While advancing the HPT probe at approximately 2 cm/sec, water is injected at a rate of about 300 ml/min through a small screened port on the side of the probe (Fig. 6). A pressure transducer located just above the probe measures the pressure required to inject water into the formation. The injection pressure and flow rate are plotted versus depth to provide a log of relative formation permeability (Fig. 7). Interpretation of the HPT log is relatively simple with higher HPT pressure indicating lower permeability and vice versa, at a constant flow rate. HPT probes typically include an EC array. Under most field conditions in fresh water formations, the EC log and HPT pressure log will display a similar trend. Sometimes the EC and HPT pressure logs do not correlate. This is especially true when high concentrations of ionic contaminants are present in the groundwater. This behavior makes the HPT-EC probe useful for tracking brine plumes, seawater intrusion, and the distribution of ionic remediation injectates. Some of these logging devices can be used to collect groundwater samples at multiple depths during logging[25][27]. Pneumatic slug testing[28][29] of DP groundwater samplers may be used to confirm HPT permeability data and obtain quantitative data for hydraulic conductivity.
Membrane Interface Probe (MIP)
The MIP was developed for investigation of volatile organic compounds (VOC) and light petroleum fuel contaminated sites in unconsolidated formations[30][31][32]. The MIP probe has a semi-permeable membrane on one side (Fig. 8) that allows VOCs to pass through, while minimizing the movement of water across the membrane. A heater block on the probe face enhances movement of VOCs across the membrane and into a nitrogen carrier gas stream. The carrier gas and contained VOCs travel up the trunkline to gas phase detectors at the surface. Detectors commonly used with the MIP include a photo-ionization detector (PID), flame ionization detector (FID) and a halogen specific detector (XSD). All three detectors can run simultaneously[32]. The PID is particularly sensitive to aromatic hydrocarbons like benzene and toluene, but will also detect the double bonds present in many chlorinated hydrocarbons like trichloroethylene (TCE) and perchloroethylene (PCE)[33][34]. The FID is effective at detecting fuel hydrocarbons (e.g. hexane and octane) and other alkanes and aromatic hydrocarbons[35][36]. The XSD is designed to detect chlorinated VOCs like dichloroethene (DCE), TCE and PCE[37]. The MIP does not provide for separation of analytes by chromatography for specificity but provides for total VOC detection[30][31]. The probe is advanced in one foot (~30 cm) increments across zones of contamination, at each depth increment the probe advancement is halted for about one minute[31][32]. This allows time for VOCs to cross the membrane and be swept up the trunkline to the detectors at the surface. This results in peaks in the detector response when contaminants are present (Fig. 9). The scale of the detector response is proportional to the level of contamination, with higher responses indicating more contamination. Several factors influence the MIP response such as formation grain size, organic carbon content, moisture content, and the analytes affinity to partition between the solid, liquid and gas phases. Thus, MIP logs provide a semi-quantitative indication of concentration[30][31]. A dipole electrical conductivity array is included near the MIP probe end to give information about formation lithology. The MIP and hydraulic profiling tool (HPT) also have been combined into one probe. This combination allows investigators to look at relative formation permeability along with VOC contaminant distribution[38]. Studies have been done to evaluate MIP operation and detection of DNAPLs[39][40][41][42][43][44].
Optical Imaging Profiler (OIP)
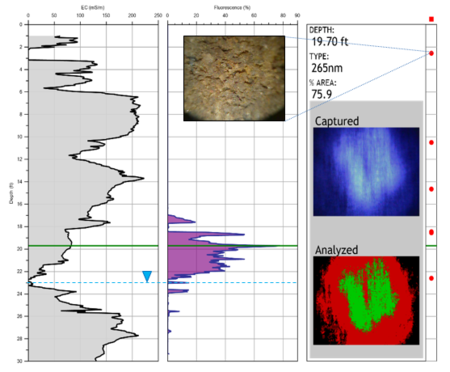
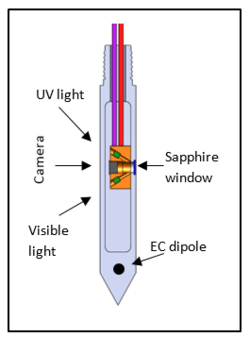
The OIP is designed to detect UV (ultraviolet) light induced fluorescence of light nonaqueous phase liquids (LNAPL), primarily fuels and related hydrocarbons, in unconsolidated materials. Chlorinated VOCs (TCE, PCE, etc.) do not fluoresce under UV light. The OIP probe is constructed with a sapphire window and light emitting diodes (LED) illuminates the soil (Fig. 10). A digital camera is mounted inside the probe, behind the window, to capture images. Logging is performed with the UV LED and images are analyzed at 30 frames per second with one image also captured every 15 mm of depth and saved in the log file. Each image covers an area of 9.5 x 7 mm. Images are displayed onscreen as the probe is advanced at 2 cm/sec. The images are analyzed in real time in the acquisition software for percent area displaying fluorescence. The operator may halt advancement of the probe at any time and capture a visible light image. The visible light images are saved with the file and markers on the log indicate depths where these images were acquired. Visible light and UV images saved with the log file can be reviewed at any time with the viewing software (Fig. 11) and used in reports or presentations. Visible light images enable the investigator to observe soil texture and color at selected depths. The probe also includes an EC dipole to provide information on soil type/lithology. Several logs can be plotted in the viewing software to provide simple 2D cross sections of lithology and product distribution. The log data may be imported into graphical software packages to create detailed 2D or 3D plots. The 2D and 3D plots may be used to develop high resolution site models to guide sampling and remediation efforts.
Summary
Several direct push (DP) logging tools have become primary devices used to conduct high-resolution site characterization (HRSC) in the environmental industry. Probes such as the CPT, EC, and HPT help to define soil types, lithology, and hydrostratigraphy. These devices are often used to define migration pathways or hydrogeologic barriers. Other logging tools, such as the MIP and OIP, help to define the presence and extent of volatile organic contaminants or fuels, respectively. Many site investigators use 2D and 3D plots of DP logging data to generate detailed conceptual site models of subsurface soils and lithology and/or contaminant distribution. Some logging tools have been combined, such as the MIP and HPT into MiHpt, to provide information on lithologic controls of contaminant distribution in one log[38]. Targeted sampling and analyses of soils and groundwater are recommended to confirm log results.
References
- ^ 1.0 1.1 1.2 1.3 1.4 McCall, W., Nielsen, D.M., Farrington, S.P., Christy, T.M., 2006. Use of Direct-Push Technologies in Environmental Site Characterization and Ground-Water Monitoring; in Practical Handbook of Environmental Site Characterization and Ground-Water Monitoring, 2nd Edition. Taylor & Francis Group, New York, NY. pgs. 345–471. doi: 10.1201/9781420032246.ch6
- ^ Lunne, T., Robertson, P.K. and Powell, J.J.M., 1997. Cone penetration testing. Geotechnical Practice. CRC Press, 352 pgs. ISBN 978-0419237501.
- ^ U.S. Environmental Protection Agency, 2005. Expedited site assessment tools for underground storage tank sites, chapter v direct push technologies. EPA 510-B-97-001. Solid Waste and Emergency Response 5403G, Washington, D.C.
- ^ Robertson, P.K., 1990. Soil classification using the cone penetration test. Canadian Geotechnical Journal, 27(1), 151-158. doi: 10.1139/t90-014
- ^ 5.0 5.1 Robertson, P.K., Sully, J.P., Woeller, D.J., Lunne, T., Powell, J.J.M. and Gillespie, D.G., 1992. Estimating coefficient of consolidation from piezocone tests. Canadian Geotechnical Journal, 29(4), 539-550. doi: 10.1139/t92-061
- ^ American Society for Testing and Materials International, 2015. D6067. Practice for using the electronic piezocone penetrometer tests for environmental site characterization. West Conshohocken, PA, USA.
- ^ American Society for Testing and Materials International, 2015. D6187. Standard practice for cone penetrometer technology characterization of petroleum contaminated sites with nitrogen laser-induced fluorescence. West Conshohocken, PA, USA.
- ^ Dobrin, Milton B., 1976. Introduction to geophysical prospecting. McGraw-Hill, New York, NY. ISBN 978-0070171954
- ^ Keys, W. Scott, 1997. A practical guide to borehole geophysics in environmental investigations. CRC Press/Lewis Publishers, Boca Raton, FL.
- ^ Rhoades, J.D. and van Schilfgaarde, J., 1976. An electrical conductivity probe for determining soil salinity. Soil Science Society of America Journal, 40(5), 647-651. doi:10.2136/sssaj1976.03615995004000050016x
- ^ 11.0 11.1 Christy, C.D., Christy, T.M. and Wittig, V., 1994, May. A percussion probing tool for the direct sensing of soil conductivity. Technical Paper No. 94-100, pp16. Report pdf
- ^ 12.0 12.1 Schulmeister, M.K., Butler, J.J., Healey, J.M., Zheng, L., Wysocki, D.A. and McCall, G.W., 2003. Direct‐push electrical conductivity logging for high‐resolution hydrostratigraphic characterization. Groundwater Monitoring & Remediation, 23(3), 52-62. doi: 10.1111/j.1745-6592.2003.tb00683.x
- ^ Wilson, J.T., Ross, R.R., Acree, S., 2005. Using direct‐push tools to map hydrostratigraphy and predict MTBE plume diving. Groundwater Monitoring & Remediation, 25(3), 93-102. doi: 10.1111/j.1745-6592.2005.00031.x
- ^ Beck, F.P., Clark, P.J. and Puls, R.W., 2000. Location and characterization of subsurface anomalies using a soil conductivity probe. Groundwater Monitoring & Remediation, 20(2), 55-59. doi:10.1111/j.1745-6592.2000.tb00265.x
- ^ Sellwood, S.M., Healey, J.M., Birk, S. and Butler, J.J., 2005. Direct‐push hydrostratigraphic profiling: coupling electrical logging and slug tests. Ground water, 43(1), 19-29. doi: 10.1111/j.1745-6584.2005.tb02282.x
- ^ Harrington, G.A. and Hendry, M.J., 2006. Using direct‐push EC logging to delineate heterogeneity in a clay‐rich aquitard. Groundwater Monitoring & Remediation, 26(1), 92-100. doi:10.1111/j.1745-6592.2006.00063.x
- ^ U.S. Environmental Protection Agency, 2000. Innovations in site characterization: geophysical investigation at hazardous waste sites. EPA-542-R-00-003. Office of Solid Waste and Emergency Response (5102G), Washington, D.C. Report pdf
- ^ Chapman, S.W. and Parker, B.L., 2005. Plume persistence due to aquitard back diffusion following dense nonaqueous phase liquid source removal or isolation. Water Resources Research, 41, W12411. doi:10.1029/2005WR004224
- ^ Hadley, P.W. and Newell, C., 2014. The new potential for understanding groundwater contaminant transport. Groundwater, 52(2), 174-186. doi:10.1111/gwat.12135
- ^ Geoprobe, 2013. Geoprobe® Hydraulic Profiling Tool (HPT) System, Standard Operating Procedure. Technical Bulletin No. MK3137. Kejr, Inc., Salina, KS.
- ^ Geoprobe, 2011. Application of the Geoprobe® HPT logging system for geo-environmental investigations. Technical Bulletin No. MK3184. Report pdf
- ^ ASTM International, 2015. Proposed standard WK48024. Standard practice for direct push hydraulic injection logging for relative permeability and lithology with depth. ASTM International Site
- ^ Dietrich, P., Butler, J.J. and Faiß, K., 2008. A rapid method for hydraulic profiling in unconsolidated formations. Ground Water, 46(2), 323-328. doi: 10.1111/j.1745-6584.2007.00377.x
- ^ Reiffsteck, P., Dorbani, B., Haza-Rozier, E. and Fry, J., 2010, May. A new hydraulic profiling tool including CPT measurements. Presented at the 2nd international symposium on cone penetration testing (CPT’10). Volume 2: Equipment and Procedures, Paper No. 1-11. Report pdf
- ^ 25.0 25.1 Pitken, S., et. al., 2004. Evaluation of the waterloo profiler as a dynamic site investigation tool. In Proceedings of the Fourth International conference on Remediation of Chlorinated and Recalcitrant Compounds, Paper 1B-07, A.R. Gavaskar and A.S.C. Chen (Eds.), Battelle Press, Columbus, OH.
- ^ Liu, Gaisheng, Butler, J. J., Roulet, E., and Knobbe, S., 2012. Hydraulic conductivity profiling with direct push methods. Grundwasser, 17(1), 19-29. doi: 10.1007/s00767-011-0182-9
- ^ McCall, W., Christy, T., and Knabach. M.E., in review. Applying the HPT-GWS for hydrostratigraphy, water quality and aquifer recharge investigations. Groundwater Monitoring & Remediation.
- ^ Geoprobe, 2014. Geoprobe® Pneumatic Slug Test Kit (GW1600), Installation and Operation Instructions for the USB System. Instructional Bulletin No. MK3195.
- ^ American Society for Testing & Materials (ASTM) International, 2015. D7242. ASTM International. D7242. Standard practice for field pneumatic slug (instantaneous change in head) tests to determine hydraulic properties of aquifers with direct push groundwater samplers. West Conshohocken, PA, USA.
- ^ 30.0 30.1 30.2 Christy, T.M., 1996. A permeable membrane sensor for the detection of volatile compounds in soil. Presented at the National Groundwater Association Outdoor Action Conference, Las Vegas, NV. May.
- ^ 31.0 31.1 31.2 31.3 American Society of Testing and Materials (ASTM) International, 2015. D7352. Standard practice for direct push technology for volatile contaminant logging with the membrane interface probe (MIP). ASTM International, West Conshohocken, PA, USA.
- ^ 32.0 32.1 32.2 Geoprobe, 2003. Geoprobe® Membrane interface probe (MIP) standard operating procedure, Technical Bulletin No. MK3010. Revised, April, 2010. Report pdf
- ^ Driscoll, J.N. and Clarici, J.B., 1976. Ein neuer photoionisationsdetektor für die gas-chromatographie. Chromatographia, 9(11), 567-570. doi: 10.1007/BF02275964
- ^ Haag, W. and Wrenn, C., 2006. The PID Handbook - Theory and applications of direct-reading photoionization detectors (PIDs). RAE Systems, 2nd Ed., San Jose, CA. ISBN 9780976816218
- ^ Skoog, Douglas A., Holler, F.J., Crouch, S.R., 2007. Principles of instrumental analysis. 6th edition. United States: Thomson Brooks/Cole, 2007. ISBN 978-0495012016
- ^ Halász, I. and Schneider, W., 1961. Quantitative gas chromatographic analysis of hydrocarbons with capillary column and flame ionization detector. Analytical Chemistry, 33(8), 978-982. doi: 10.1021/ac60176a034
- ^ OI Analytical, 2001. Using the halogen specific detector (XSDTM) as an alternative to the ELCD in USEPA Methods: Presented at the 2001 Pittsburgh Conference on Analytical Chemistry and Applied Spectroscopy, New Orleans, LA. Report pdf
- ^ 38.0 38.1 McCall, W., Christy, T.M., Pipp, D., Terkelsen, M., Christensen, A., Weber, K. and Engelsen, P., 2014. Field application of the combined membrane‐interface probe and hydraulic profiling tool (MiHpt). Groundwater Monitoring & Remediation, 34(2), 85-95. doi: 10.1111/gwmr.12051
- ^ Costanza, J. and Davis, W.M., 2000. Rapid detection of volatile organic compounds in the subsurface by membrane introduction into a direct sampling ion‐trap mass spectrometer. Field Analytical Chemistry & Technology, 4(5), 246-254. doi: 10.1002/1520-6521(2000)4:5<246::AID-FACT4>3.0.CO;2-W
- ^ McAndrews, B., Heinze, K. and DiGuiseppi, W., 2003. Defining TCE plume source areas using the membrane interface probe (MIP). Soil and Sediment Contamination, 12(6), 799-813. doi: 10.1080/714037716
- ^ Adamson, D.T., Chapman, S., Mahler, N., Newell, C., Parker, B., Pitkin, S., Rossi, M. and Singletary, M., 2014. Membrane Interface Probe Protocol for Contaminants in Low‐Permeability Zones. Groundwater, 52(4), 550-565. doi: 10.1111/gwat.12085
- ^ Griffin, T.W. and Watson, K.W., 2002. A comparison of field techniques for confirming dense nonaqueous phase liquids. Groundwater Monitoring & Remediation, 22(2), 48-59. doi:10.1111/j.1745-6592.2002.tb00312.x
- ^ Ravella, M., R.J. Fiacco, Jr., Frazier D. Wanty, and L. Burkhardt, 2007. Application of the membrane interface probe (MIP) to delineate subsurface DNAPL contamination. Environmental Engineer: Applied Research and Practice 1.
- ^ Bumberger, J., Radny, D., Berndsen, A., Goblirsch, T., Flachowsky, J. and Dietrich, P., 2012. Carry‐over effects of the membrane interface probe. Groundwater, 50(4), 578-584. doi:10.1111/j.1745-6584.2011.00879.x
See Also
- Geoprobe General Direct Push Equipment and Tools
- General Direct Push Equipment and Tools
- DP Logging Technology, EC, HPT, MIP, CPT, OIP
- DP Laser Induced Fluorescence Logging, UVOST, TarGOST
- Review of DP Technologies Including Some Logging Tools
- Information on the Waterloo APS Groundwater Profiling System
- Early Development of the CPT/SCAPS System for Subsurface Investigations
- Cone Penetration Test (CPT)
- Expedited Site Assessment Tools for Underground Storage Tank Sites: (See Chapter V – Direct Push Technologies)
- CPT/SCAPS Heavy Metal Sensors
- CPT/SCAPS Based MIP Logging
- CPT/SCAPS Hydrosparge for VOCs
- CPT/SCAPS Thermal Desorption Soil Profiling for VOCs
- CPT/SCAPS LIF Sensor for Petroleum/Oil/Lubricants
- DP/HPT & CPT for Mass Transfer in Low K Zones
- Basic Chemical and Physical Properties of TCE with Human Exposure Section
- DP Optical Screening Tool for Hi Res. DNAPL
- DP Chemical Sensors for DNAPL & VOCs
- Electrical Conductivity SOP
- MIP Logging SOP
- HPT SOP
- FID Detector Information
- PID Detector Information
- Manufacturer Information for the Halogen Specific Detector/XSD
- ECD Detector Information
- PID Lamps
- Tech Review of PID Performance pdf
- XSD Detector Application pdf
- Direct Push Optical Screening Tool for High-Resolution, Real-Time Mapping of Chlorinated Solvent DNAPL Architecture
